

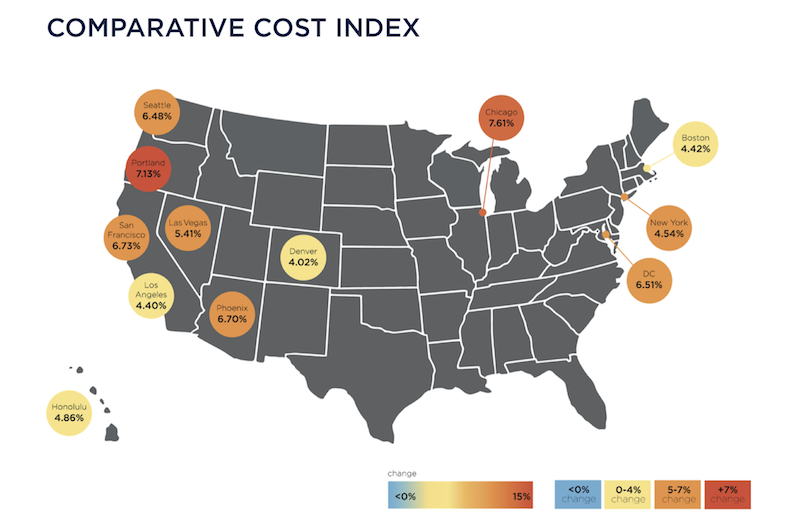
Construction costs nationally rose in 2018 by an average of 5.73%, with Chicago and Portland, Ore., showing the greatest increases among major cities.
Costs rose at a time when many markets are at or near their construction-activity cycle, and as industry unemployment remained higher than the country’s at large.
Those are two findings in the latest Quarterly Construction Cost Report for North America, released by the property and construction consultant Rider Levett Bucknall (RLB), and based on an analysis of 15 building typologies in 14 metros. (The sectors analyzed include single- and multifamily housing, as well as parking structures.)
The full quarterly report can be accessed here.
The U.S. Department of Commerce estimates that, as of January 2019, the seasonally adjusted annual rate for Construction Put-in-Place was just under $1.28 trillion, 0.3% above the same monthly estimate a year earlier.
However, the National Construction Cost Index has been on a fairly steady upward trajectory since the first quarter of 2014. As of the first quarter of 2019, that Index stood at 198.33 (relative to the April 2001 base of 100, recalibrated as of April 2011).
Some examples of RLB’s findings include its estimate that the cost of building prime office space is highest in Boston and New York, lowest in Phoenix and Denver. Los Angeles has the highest construction costs for hospitals, and Las Vegas the lowest for elementary schools.
Eight of the 14 markets analyzed were at their construction-activity peaks by the end of last year. Chicago’s construction costs, in general, increased the most (7.61%, to $22.8 billion) among the metros analyzed, even though it was the only city that fell into the “mid decline” category for construction activity. Honolulu, the only city in “trough growth,” saw construction costs rise by 4.86% to $24.8 billion.
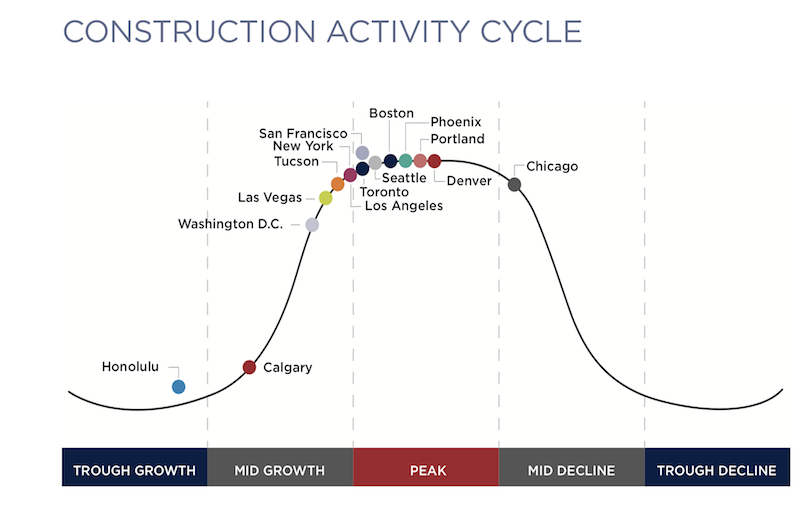 Eight of the 14 metros tracked are at the top of their constuction cycles. Image: RLB
San Francisco had the highest construction put-in-place, $26.844 billion, up 6.73%.
Increasingly expensive construction activity occurred despite a decrease in architectural billings, and an industry unemployment rate that, at 5.1% in the fourth quarter of last year, was down from 7.4% in the first quarter of 2018.
The U.S. Gross Domestic Product closed out the fourth quarter at 2.6%, down from a mid-year peak of 4.2%. Inflation last year was up only 1.91%.
The report also analyzes construction costs in Canada, specifically Calgary, Alberta, and Toronto, Ontario. RLB notes that those two cities are driving much of the growth in Canada’s economy.
Related Stories

Market Data | Aug 2, 2022
Nonresidential construction spending falls 0.5% in June, says ABC
National nonresidential construction spending was down by 0.5% in June, according to an Associated Builders and Contractors analysis of data published today by the U.S. Census Bureau.

Market Data | Jul 28, 2022
The latest Beck Group report sees earlier project collaboration as one way out of the inflation/supply chain malaise
In the first six months of 2022, quarter-to-quarter inflation for construction materials showed signs of easing, but only slightly.

Hotel Facilities | Jul 28, 2022
As travel returns, U.S. hotel construction pipeline growth follows
According to the recently released United States Construction Pipeline Trend Report from Lodging Econometrics (LE), the total U.S. construction pipeline stands at 5,220 projects/621,268 rooms at the close of 2022’s second quarter, up 9% Year-Over-Year (YOY) by projects and 4% YOY by rooms.

Codes and Standards | Jul 22, 2022
Hurricane-resistant construction may be greatly undervalued
New research led by an MIT graduate student at the school’s Concrete Sustainability Hub suggests that the value of buildings constructed to resist wind damage in hurricanes may be significantly underestimated.

Market Data | Jul 21, 2022
Architecture Billings Index continues to stabilize but remains healthy
Architecture firms reported increasing demand for design services in June, according to a new report today from The American Institute of Architects (AIA).

Market Data | Jul 21, 2022
Despite deteriorating economic conditions, nonresidential construction spending projected to increase through 2023
Construction spending on buildings is projected to increase just over nine percent this year and another six percent in 2023, according to a new report from the American Institute of Architects (AIA).

Building Team | Jul 18, 2022
Understanding the growing design-build market
FMI’s new analysis of the design-build market forecast for the next fives years shows that this delivery method will continue to grow, despite challenges from the COVID-19 pandemic.

Market Data | Jul 1, 2022
Nonresidential construction spending slightly dips in May, says ABC
National nonresidential construction spending was down by 0.6% in May, according to an Associated Builders and Contractors analysis of data published today by the U.S. Census Bureau.

Market Data | Jun 30, 2022
Yardi Matrix releases new national rent growth forecast
Rents in most American cities continue to rise slightly each month, but are not duplicating the rapid escalation rates exhibited in 2021.

Market Data | Jun 22, 2022
Architecture Billings Index slows but remains strong
Architecture firms reported increasing demand for design services in May, according to a new report today from The American Institute of Architects (AIA).


