

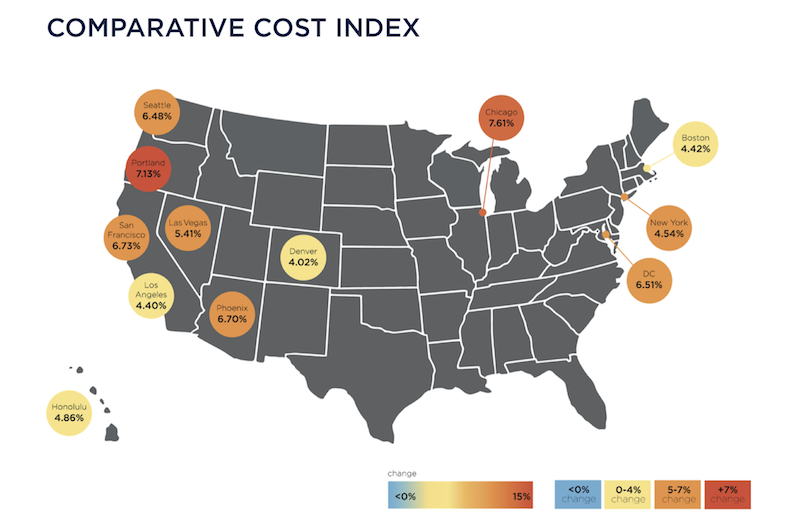
Construction costs nationally rose in 2018 by an average of 5.73%, with Chicago and Portland, Ore., showing the greatest increases among major cities.
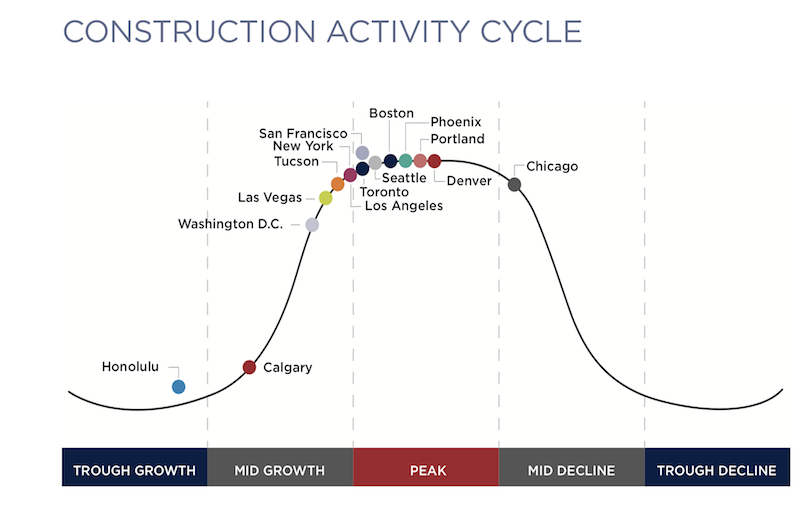
Costs rose at a time when many markets are at or near their construction-activity cycle, and as industry unemployment remained higher than the country’s at large.
Those are two findings in the latest Quarterly Construction Cost Report for North America, released by the property and construction consultant Rider Levett Bucknall (RLB), and based on an analysis of 15 building typologies in 14 metros. (The sectors analyzed include single- and multifamily housing, as well as parking structures.)
The full quarterly report can be accessed here.
The U.S. Department of Commerce estimates that, as of January 2019, the seasonally adjusted annual rate for Construction Put-in-Place was just under $1.28 trillion, 0.3% above the same monthly estimate a year earlier.
However, the National Construction Cost Index has been on a fairly steady upward trajectory since the first quarter of 2014. As of the first quarter of 2019, that Index stood at 198.33 (relative to the April 2001 base of 100, recalibrated as of April 2011).
Some examples of RLB’s findings include its estimate that the cost of building prime office space is highest in Boston and New York, lowest in Phoenix and Denver. Los Angeles has the highest construction costs for hospitals, and Las Vegas the lowest for elementary schools.
Eight of the 14 markets analyzed were at their construction-activity peaks by the end of last year. Chicago’s construction costs, in general, increased the most (7.61%, to $22.8 billion) among the metros analyzed, even though it was the only city that fell into the “mid decline” category for construction activity. Honolulu, the only city in “trough growth,” saw construction costs rise by 4.86% to $24.8 billion.
 Eight of the 14 metros tracked are at the top of their constuction cycles. Image: RLB
San Francisco had the highest construction put-in-place, $26.844 billion, up 6.73%.
Increasingly expensive construction activity occurred despite a decrease in architectural billings, and an industry unemployment rate that, at 5.1% in the fourth quarter of last year, was down from 7.4% in the first quarter of 2018.
The U.S. Gross Domestic Product closed out the fourth quarter at 2.6%, down from a mid-year peak of 4.2%. Inflation last year was up only 1.91%.
The report also analyzes construction costs in Canada, specifically Calgary, Alberta, and Toronto, Ontario. RLB notes that those two cities are driving much of the growth in Canada’s economy.
Related Stories

Building Team | Oct 26, 2022
The U.S. hotel construction pipeline shows positive growth year-over-year at Q3 2022 close
According to the third quarter Construction Pipeline Trend Report for the United States from Lodging Econometrics (LE), the U.S. construction pipeline stands at 5,317 projects/629,489 rooms, up 10% by projects and 6% rooms Year-Over-Year (YOY).

Designers | Oct 19, 2022
Architecture Billings Index moderates but remains healthy
For the twentieth consecutive month architecture firms reported increasing demand for design services in September, according to a new report today from The American Institute of Architects (AIA).

Market Data | Oct 17, 2022
Calling all AEC professionals! BD+C editors need your expertise for our 2023 market forecast survey
The BD+C editorial team needs your help with an important research project. We are conducting research to understand the current state of the U.S. design and construction industry.

Market Data | Oct 14, 2022
ABC’s Construction Backlog Indicator Jumps in September; Contractor Confidence Remains Steady
Associated Builders and Contractors reports today that its Construction Backlog Indicator increased to 9.0 months in September, according to an ABC member survey conducted Sept. 20 to Oct. 5.

Market Data | Oct 12, 2022
ABC: Construction Input Prices Inched Down in September; Up 41% Since February 2020
Construction input prices dipped 0.1% in September compared to the previous month, according to an Associated Builders and Contractors analysis of U.S. Bureau of Labor Statistics’ Producer Price Index data released today.

Laboratories | Oct 5, 2022
Bigger is better for a maturing life sciences sector
CRB's latest report predicts more diversification and vertical integration in research and production.

Market Data | Aug 25, 2022
‘Disruptions’ will moderate construction spending through next year
JLL’s latest outlook predicts continued pricing volatility due to shortages in materials and labor

Market Data | Aug 2, 2022
Nonresidential construction spending falls 0.5% in June, says ABC
National nonresidential construction spending was down by 0.5% in June, according to an Associated Builders and Contractors analysis of data published today by the U.S. Census Bureau.

Market Data | Jul 28, 2022
The latest Beck Group report sees earlier project collaboration as one way out of the inflation/supply chain malaise
In the first six months of 2022, quarter-to-quarter inflation for construction materials showed signs of easing, but only slightly.

Hotel Facilities | Jul 28, 2022
As travel returns, U.S. hotel construction pipeline growth follows
According to the recently released United States Construction Pipeline Trend Report from Lodging Econometrics (LE), the total U.S. construction pipeline stands at 5,220 projects/621,268 rooms at the close of 2022’s second quarter, up 9% Year-Over-Year (YOY) by projects and 4% YOY by rooms.


