


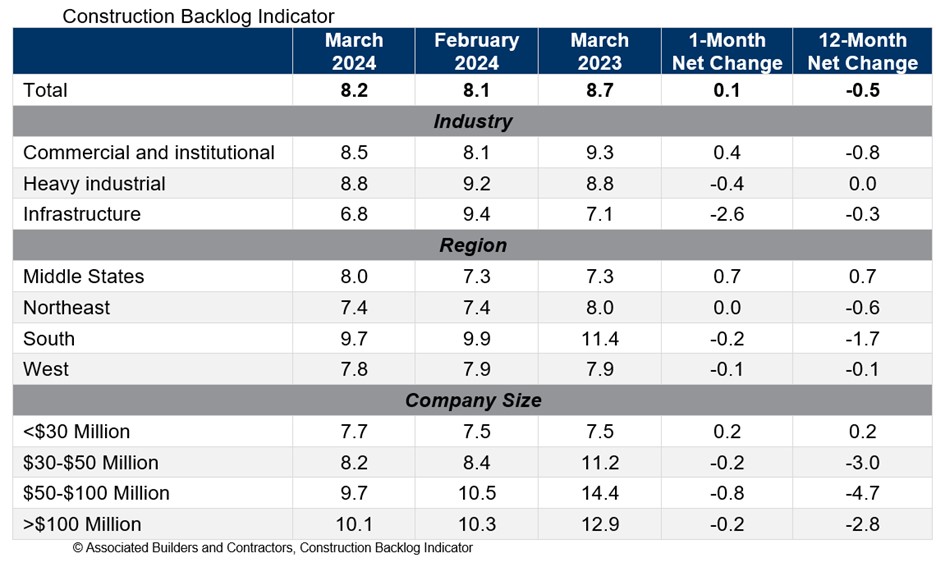
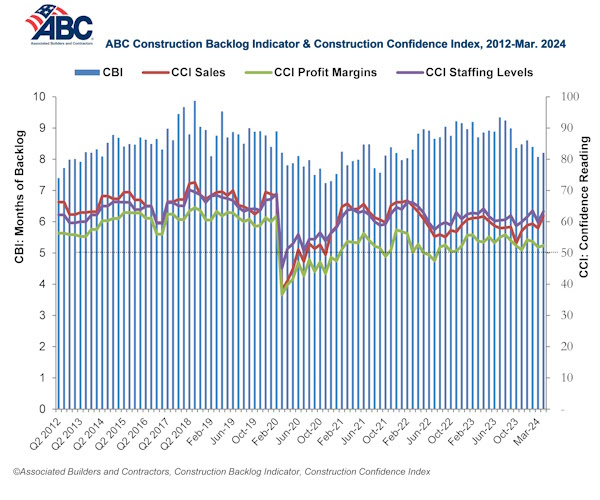
Associated Builders and Contractors reported today that its Construction Backlog Indicator increased to 8.2 months in March from 8.1 months in February, according to an ABC member survey conducted March 20 to April 3. The reading is down 0.5 months from March 2023.
View ABC’s Construction Backlog Indicator and Construction Confidence Index tables for March. View the full Construction Backlog Indicator and Construction Confidence Index data series.
Backlog is down over the past year for every region except for the Middle States, which now has the second largest backlog of any region. The South continues to have the largest backlog despite a large decline over the past year.
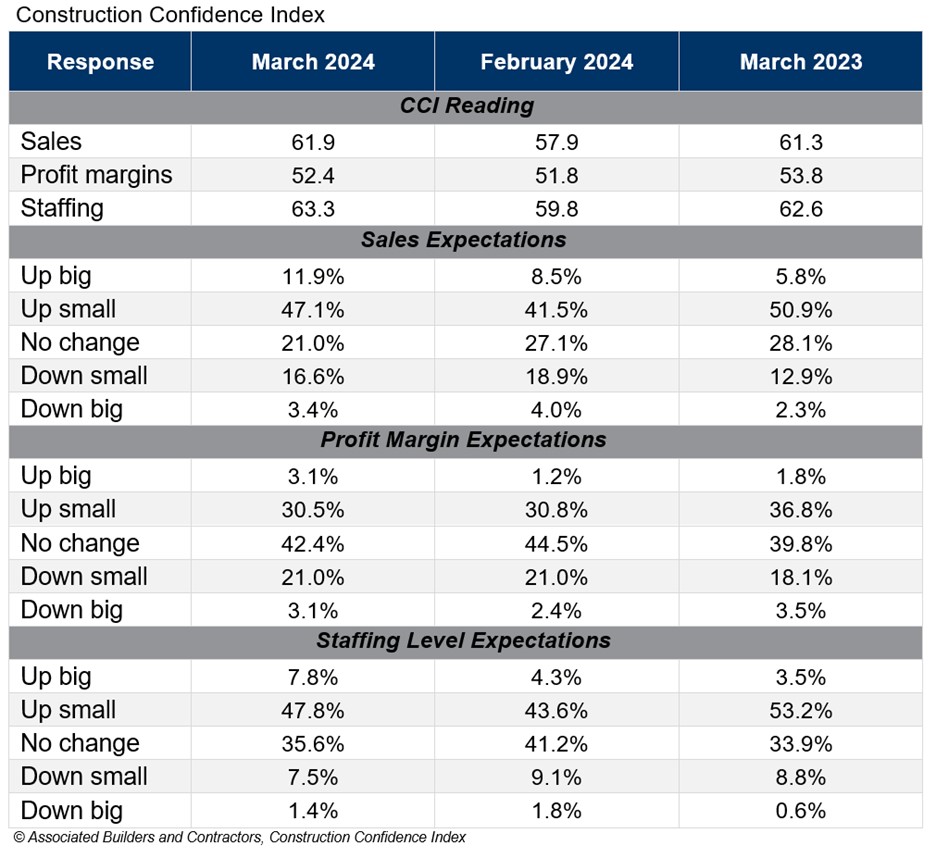
ABC’s Construction Confidence Index readings for sales, profit margins and staffing levels increased in March. All three readings remain above the threshold of 50, indicating expectations for growth over the next six months.
“Given headwinds such as high borrowing costs, emerging supply chain issues, project financing challenges and labor shortages, the persistent optimism among nonresidential construction contractors is astonishing,” said ABC Chief Economist Anirban Basu. “Last month, contractors reported rising backlog and greater conviction regarding likely growth in sales, employment and profit margins.
“While certain readings are below year-ago levels, there was broad-based improvement in March,” said Basu. “For instance, in the category of profit margins, 32% of those surveyed in February expected improvement over the next six months. That share rose to nearly 34% in March, with only 24% hinting at near-term margin compression. That indicates that though costs of delivering construction services continue to rise, contractors collectively enjoy enough pricing power to support stable to rising margins. If interest rates begin to decline during the summer as is widely expected, confidence is likely to climb further.”
Note: The reference months for the Construction Backlog Indicator and Construction Confidence Index data series were revised on May 12, 2020, to better reflect the survey period. CBI quantifies the previous month's work under contract based on the latest financials available, while CCI measures contractors' outlook for the next six months. View the methodology for both indicators.
Related Stories

Market Data | Apr 1, 2024
Nonresidential construction spending dips 1.0% in February, reaches $1.179 trillion
National nonresidential construction spending declined 1.0% in February, according to an Associated Builders and Contractors analysis of data published today by the U.S. Census Bureau. On a seasonally adjusted annualized basis, nonresidential spending totaled $1.179 trillion.

Market Data | Mar 26, 2024
Architecture firm billings see modest easing in February
Architecture firm billings continued to decline in February, with an AIA/Deltek Architecture Billings Index (ABI) score of 49.5 for the month. However, February’s score marks the most modest easing in billings since July 2023 and suggests that the recent slowdown may be receding.

K-12 Schools | Mar 18, 2024
New study shows connections between K-12 school modernizations, improved test scores, graduation rates
Conducted by Drexel University in conjunction with Perkins Eastman, the research study reveals K-12 school modernizations significantly impact key educational indicators, including test scores, graduation rates, and enrollment over time.

MFPRO+ News | Mar 16, 2024
Multifamily rents stable heading into spring 2024
National asking multifamily rents posted their first increase in over seven months in February. The average U.S. asking rent rose $1 to $1,713 in February 2024, up 0.6% year-over-year.

Market Data | Mar 14, 2024
Download BD+C's March 2024 Market Intelligence Report
U.S. construction spending on buildings-related work rose 1.4% in January, but project teams continue to face headwinds related to inflation, interest rates, and supply chain issues, according to Building Design+Construction's March 2024 Market Intelligence Report (free PDF download).

Contractors | Mar 12, 2024
The average U.S. contractor has 8.1 months worth of construction work in the pipeline, as of February 2024
Associated Builders and Contractors reported that its Construction Backlog Indicator declined to 8.1 months in February, according to an ABC member survey conducted Feb. 20 to March 5. The reading is down 1.1 months from February 2023.

Market Data | Mar 6, 2024
Nonresidential construction spending slips 0.4% in January
National nonresidential construction spending decreased 0.4% in January, according to an Associated Builders and Contractors analysis of data published today by the U.S. Census Bureau. On a seasonally adjusted annualized basis, nonresidential spending totaled $1.190 trillion.

Multifamily Housing | Mar 4, 2024
Single-family rentals continue to grow in BTR communities
Single-family rentals are continuing to grow in built-to-rent communities. Both rent and occupancy growth have been strong in recent months while remaining a financially viable option for renters.

MFPRO+ News | Mar 2, 2024
Job gains boost Yardi Matrix National Rent Forecast for 2024
Multifamily asking rents broke the five-month streak of sequential average declines in January, rising 0.07 percent, shows a new special report from Yardi Matrix.

K-12 Schools | Feb 29, 2024
Average age of U.S. school buildings is just under 50 years
The average age of a main instructional school building in the United States is 49 years, according to a survey by the National Center for Education Statistics (NCES). About 38% of schools were built before 1970. Roughly half of the schools surveyed have undergone a major building renovation or addition.


