


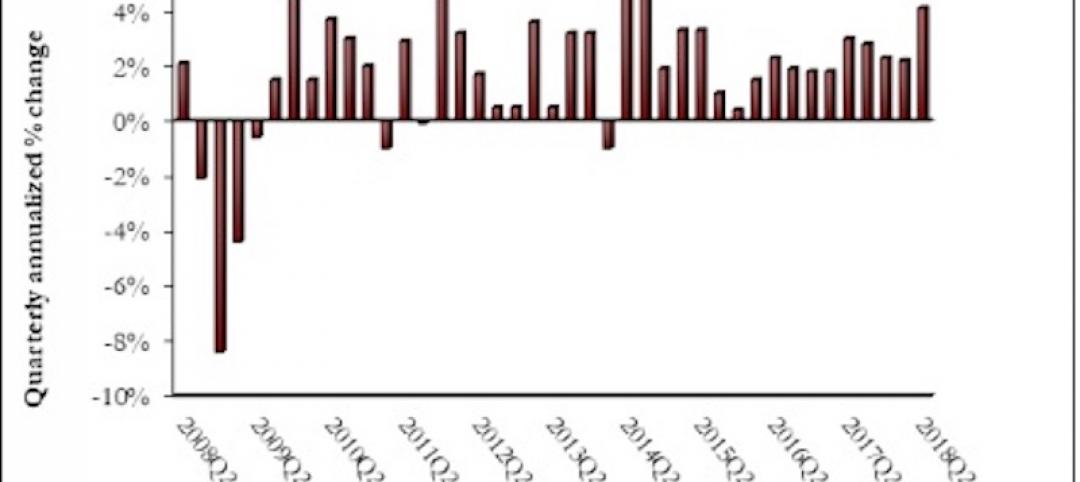
For the fifteenth consecutive month architecture firms reported increasing demand for design services in April, according to a new report today from The American Institute of Architects (AIA).
AIA’s Architecture Billings Index score for April was 56.5 compared to 58.0 in March. Any score above 50 indicates an increase in billings. During April, scores for both new project inquiries and design contracts moderated slightly, but remained strong, posting scores of 62.3 and 55.4, respectively.
“While business conditions at architecture firms have been very encouraging over the past year, project activity has been steadily shifting toward work on existing buildings,” said AIA Chief Economist, Kermit Baker, Hon. AIA, PhD. “Billings for reconstruction projects exceeded those for new construction for the first time in the last two decades. While the reconstruction share of building activity will continue to ebb and flow, in general, we’ll continue to move toward an increased share of building activity for reconstruction and a decreased share for new construction.”
Key ABI Highlights for April Include:
- Regional averages: West (58.2); Midwest (57.6); South (57.3); Northeast (53.1)
- Sector index breakdown: mixed practice (61.2); commercial/industrial (60.7); multi-family residential (57.2); institutional (51.8)
The regional and sector categories are calculated as a three-month moving average, whereas the national index, design contracts and inquiries are monthly numbers.
To learn more about recent economic developments impacting design and construction, visit AIA’s website.
Related Stories

Market Data | Aug 13, 2018
First Half 2018 commercial and multifamily construction starts show mixed performance across top metropolitan areas
Gains reported in five of the top ten markets.

Market Data | Aug 10, 2018
Construction material prices inch down in July
Nonresidential construction input prices increased fell 0.3% in July but are up 9.6% year over year.

Market Data | Aug 9, 2018
Projections reveal nonresidential construction spending to grow
AIA releases latest Consensus Construction Forecast.
Market Data | Aug 7, 2018
New supply's impact illustrated in Yardi Matrix national self storage report for July
The metro with the most units under construction and planned as a percent of existing inventory in mid-July was Nashville, Tenn.

Market Data | Aug 3, 2018
U.S. multifamily rents reach new heights in July
Favorable economic conditions produce a sunny summer for the apartment sector.
Market Data | Aug 2, 2018
Nonresidential construction spending dips in June
“The hope is that June’s construction spending setback is merely a statistical aberration,” said ABC Chief Economist Anirban Basu.

Market Data | Aug 1, 2018
U.S. hotel construction pipeline continues moderate growth year-over-year
The hotel construction pipeline has been growing moderately and incrementally each quarter.
Market Data | Jul 30, 2018
Nonresidential fixed investment surges in second quarter
Nonresidential fixed investment represented an especially important element of second quarter strength in the advance estimate.

Market Data | Jul 11, 2018
Construction material prices increase steadily in June
June represents the latest month associated with rapidly rising construction input prices.

Market Data | Jun 26, 2018
Yardi Matrix examines potential regional multifamily supply overload
Outsize development activity in some major metros could increase vacancy rates and stagnate rent growth.


