


The Architecture Billings Index (ABI), produced by the AIA Economics & Market Research Group, is a leading economic indicator that provides an approximately nine- to twelve-month glimpse into the future of nonresidential construction spending activity. The diffusion indexes contained in the full report are derived from a monthly “work-on-the-boards” survey that is sent to a panel of AIA member-owned firms.
Participants are asked whether their billings increased, decreased, or stayed the same in the month that just ended as compared to the prior month, and the results are then compiled into the ABI. These monthly results are also seasonally adjusted to allow for comparison to prior months. The monthly ABI index scores are centered around 50, with scores above 50 indicating an aggregate increase in billings, and scores below 50 indicating a decline.
Following a generally positive performance in 2015, the Architecture Billings Index has begun this year modestly dipping back into negative terrain. The AIA reported the January ABI score was 49.6, down slightly from the mark of 51.3 in the previous month. This score reflects a minor decrease in design services (any score above 50 indicates an increase in billings). The new projects inquiry index was 55.3, down from a reading of 60.5 the previous month.
“The fundamentals are mostly sound in the nonresidential design and construction market,” said AIA Chief Economist, Kermit Baker, Hon. AIA, PhD. “January was a rocky month throughout the economy, with falling oil prices, international economic concerns, and with steep declines in stock market valuations in the U.S. and elsewhere. Some of the fallout of this uncertainty may have affected progress on design projects.”
Key January* ABI highlights:
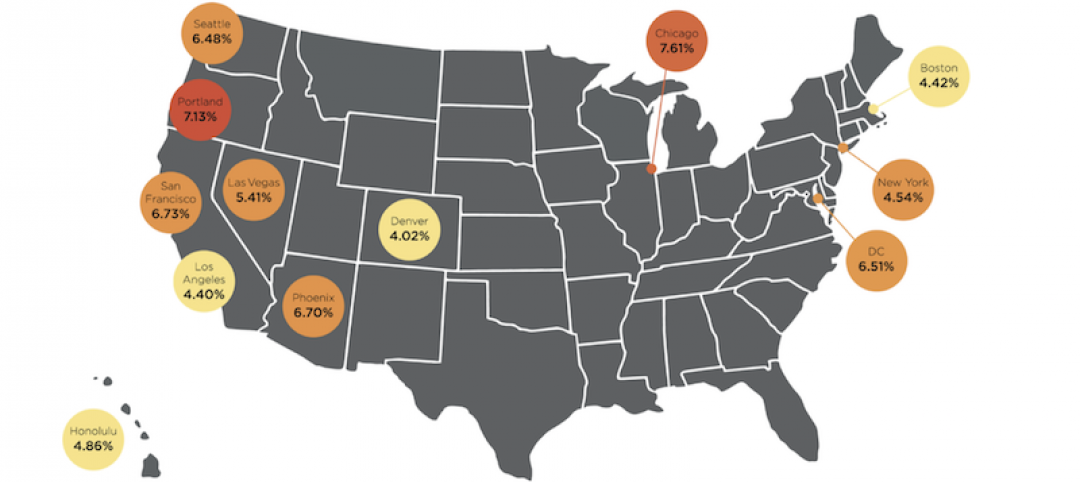
- Regional averages: West (50.8), Northeast (50.4), South (50.3), Midwest (48.9),
- Sector index breakdown: multifamily residential (51.9), commercial / industrial (50.5), institutional (49.9), mixed practice (49.0)
- Project inquiries index: 55.3
- Design contracts index: 50.9
The regional and sector categories are calculated as a 3-month moving average, whereas the national index, design contracts and inquiries are monthly numbers.
* Every January the AIA research department updates the seasonal factors used to calculate the ABI, resulting in a revision of recent ABI values.
Related Stories
Market Data | Jun 12, 2019
Construction input prices see slight increase in May
Among the 11 subcategories, six saw prices fall last month, with the largest decreases in natural gas.

Market Data | Jun 3, 2019
Nonresidential construction spending up 6.4% year over year in April
Among the 16 sectors tracked by the U.S. Census Bureau, nine experienced an increase in monthly spending, led by water supply and highway and street.

Market Data | Jun 3, 2019
4.1% annual growth in office asking rents above five-year compound annual growth rate
Market has experienced no change in office vacancy rates in three quarters.

Market Data | May 30, 2019
Construction employment increases in 250 out of 358 metros from April 2018 to April 2019
Demand for work is outpacing the supply of workers.
Market Data | May 24, 2019
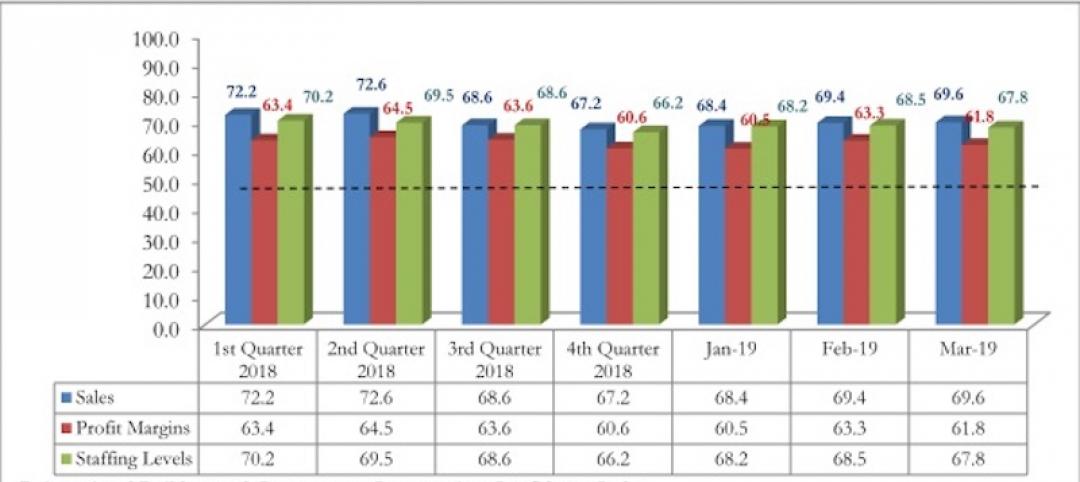
Construction contractors confidence remains high in March
More than 70% of contractors expect to increase staffing levels over the next six months.
Market Data | May 22, 2019
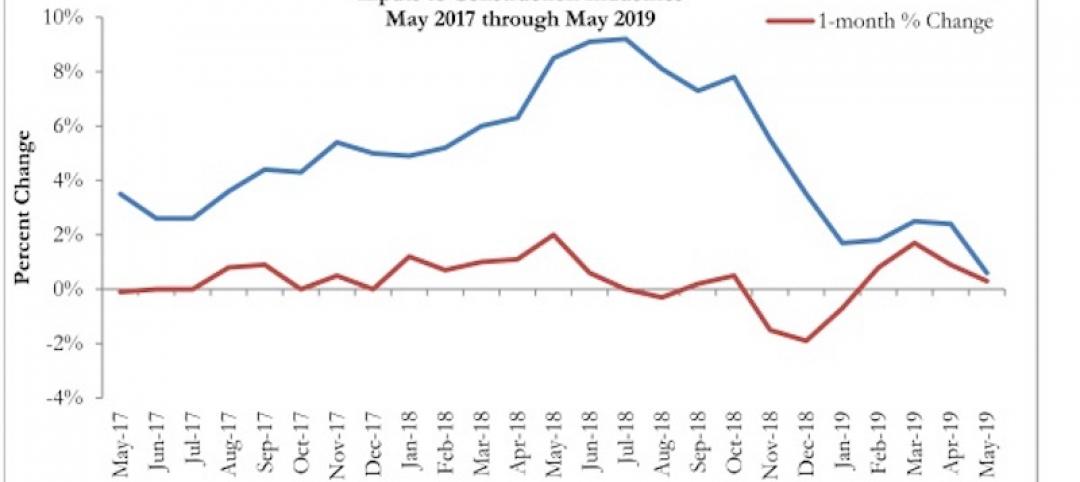
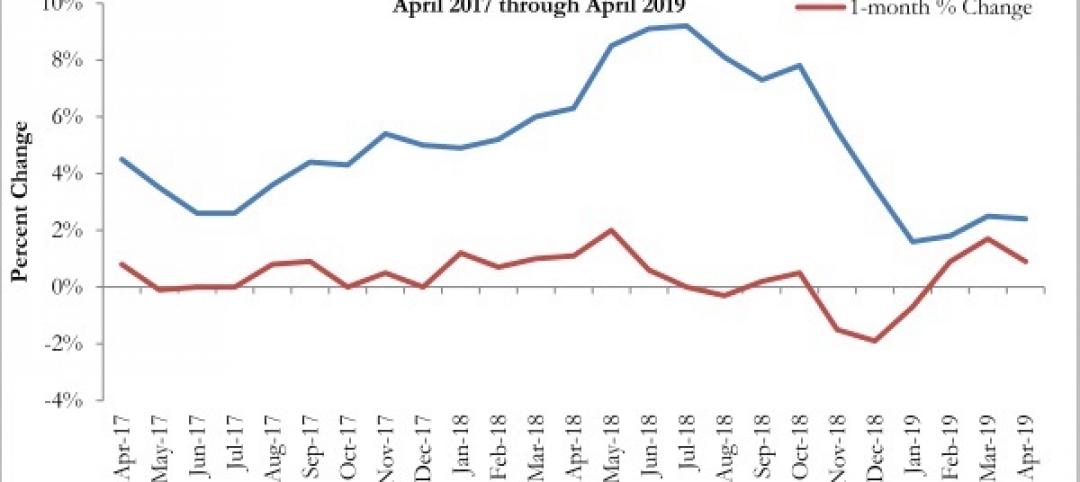
Slight rebound for architecture billings in April
AIA’s ABI score for April showed a small increase in design services at 50.5 in April.

Market Data | May 9, 2019
The U.S. hotel construction pipeline continues to grow in the first quarter as the economy shows surprising strength
Projects currently under construction stand at 1,709 projects/227,924 rooms.
Market Data | May 9, 2019
Construction input prices continue to rise
Nonresidential input prices rose 0.9% compared to March and are up 2.8% on an annual basis.
Market Data | May 7, 2019
Construction costs in major metros continued to climb last year
Latest Rider Levett Bucknall report estimates rise at more than double the rate of 2018 Growth Domestic Product.
Market Data | Apr 29, 2019
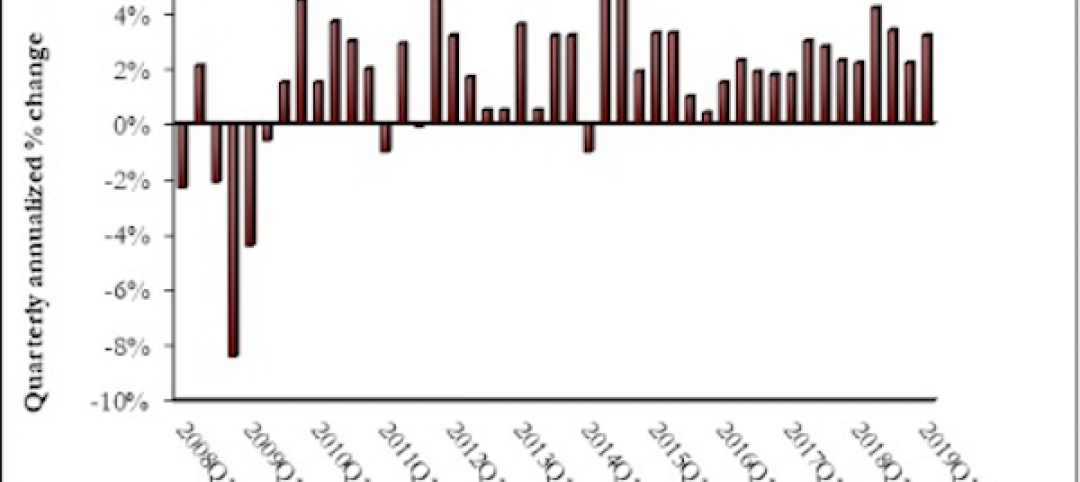
U.S. economic growth crosses 3% threshold to begin the year
Growth was fueled by myriad factors, including personal consumption expenditures, private inventory investment, surprisingly rapid growth in exports, state and local government spending and intellectual property.


