


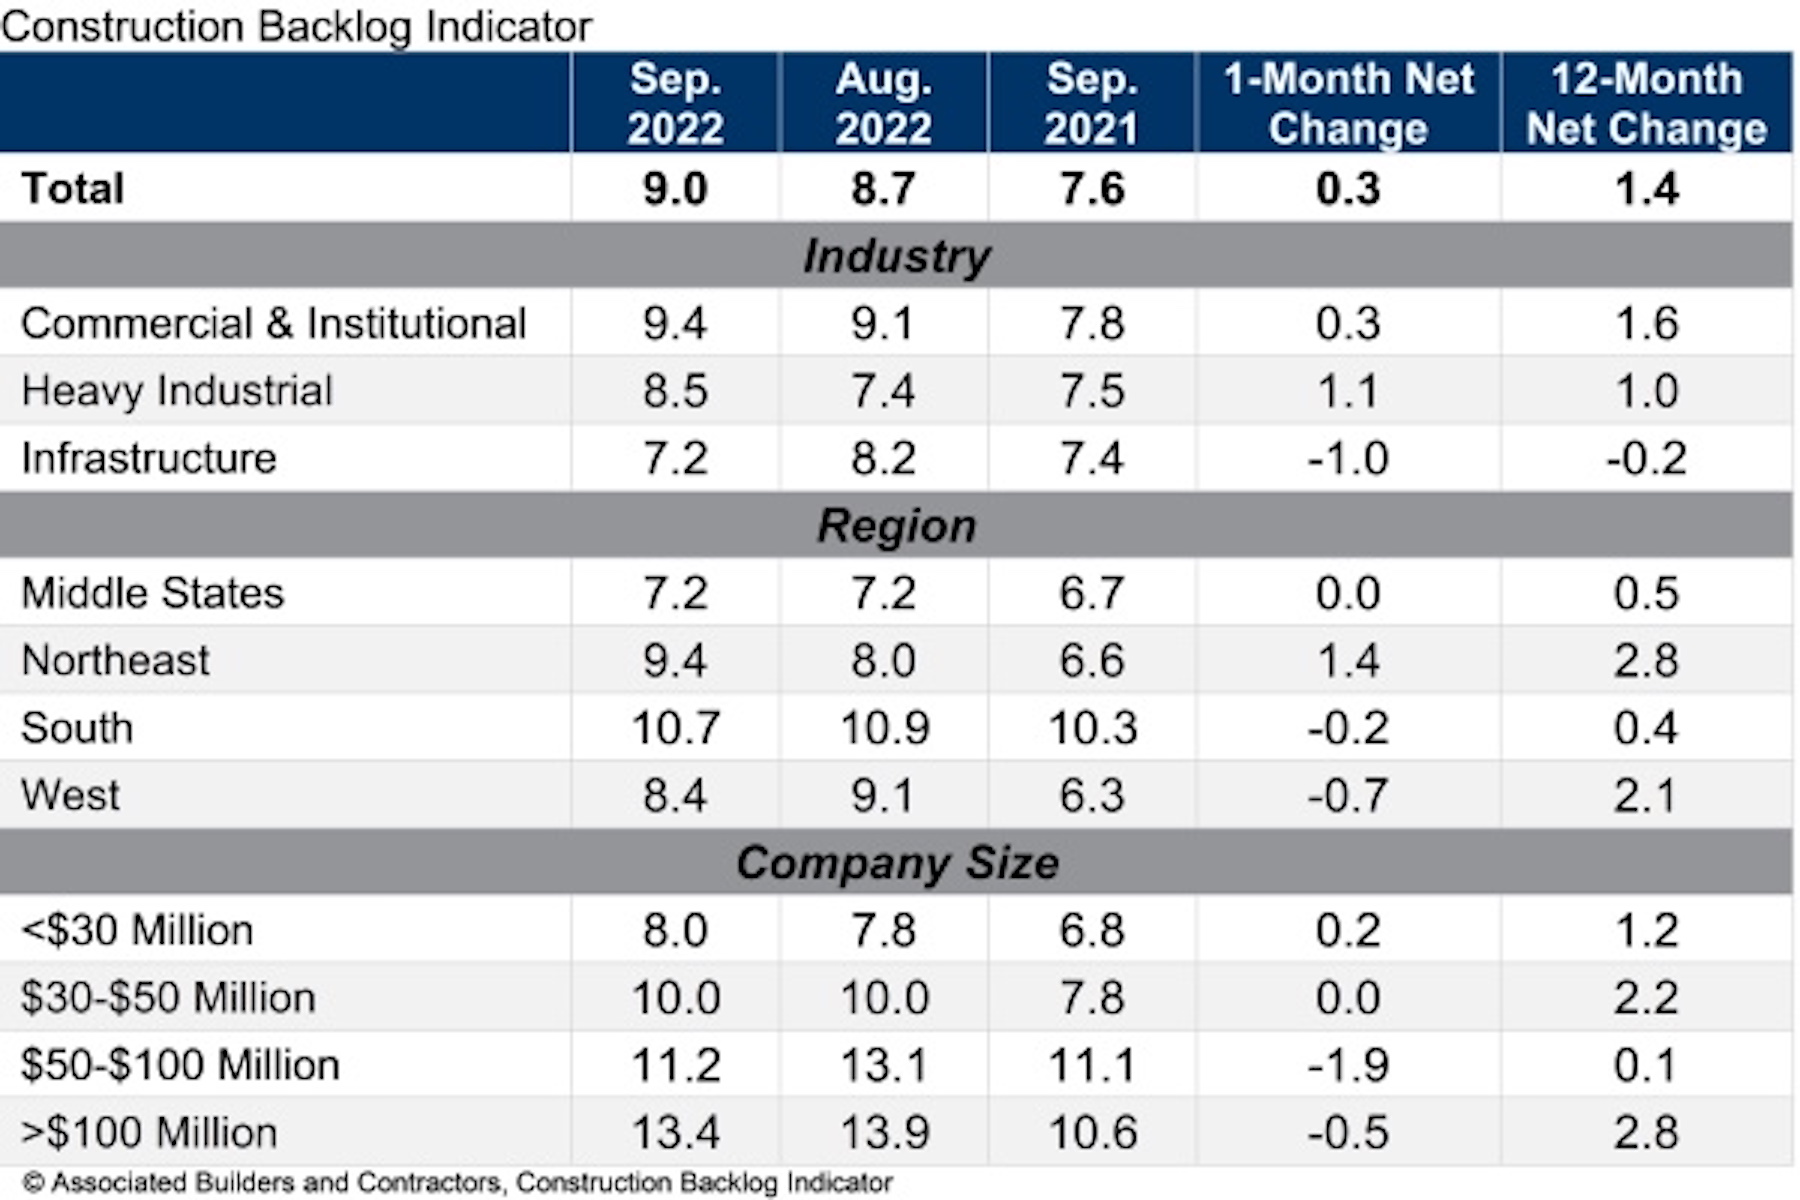
Associated Builders and Contractors reports today that its Construction Backlog Indicator increased to 9.0 months in September, according to an ABC member survey conducted Sept. 20 to Oct. 5. The reading is 1.4 months higher than in September 2021.
View ABC’s Construction Backlog Indicator and Construction Confidence Index tables for September 2022.
Backlog reached its highest level since May 2022 and is once again above the level observed at the start of the pandemic (8.9 months in February 2020). Backlog in heavy industrial increased sizably in September, spurred by a 21.5% year-over-year increase in manufacturing-related construction spending.
ABC’s Construction Confidence Index readings for profit margins and staffing levels increased in September, while the reading for sales moved slightly lower. All three readings remain above the threshold of 50, indicating expectations of growth over the next six months.
“The construction confidence and backlog metrics appear strong despite the U.S. economy facing headwinds like inflation, financial market volatility and rapidly rising borrowing costs,” said ABC Chief Economist Anirban Basu. “Contractors remain decidedly upbeat, with backlog expanding and expectations for rising sales, employment and profit margins over the next six months.
“One would think the recent surge in interest rates would be enough to dampen contractor confidence,” said Basu. “Instead, project owners continue to move forward with a significant number of projects. Faced with high demand for their services, contractors continue to show pricing power, helping to offset rising compensation and other construction delivery costs.”
Note: The reference months for the Construction Backlog Indicator and Construction Confidence Index data series were revised on May 12, 2020, to better reflect the survey period. CBI quantifies the previous month’s work under contract based on the latest financials available, while CCI measures contractors’ outlook for the next six months.
Related Stories
Market Data | Nov 10, 2021
Construction input prices see largest monthly increase since June
Construction input prices are 21.1% higher than in October 2020.
Market Data | Nov 9, 2021
Continued increases in construction materials prices starting to drive up price of construction projects
Supply chain and labor woes continue.
Market Data | Nov 5, 2021
Construction firms add 44,000 jobs in October
Gain occurs even as firms struggle with supply chain challenges.
Market Data | Nov 3, 2021
One-fifth of metro areas lost construction jobs between September 2020 and 2021
Beaumont-Port Arthur, Texas and Sacramento--Roseville--Arden-Arcade Calif. top lists of gainers.
Market Data | Nov 2, 2021
Construction spending slumps in September
A drop in residential work projects adds to ongoing downturn in private and public nonresidential.

Hotel Facilities | Oct 28, 2021
Marriott leads with the largest U.S. hotel construction pipeline at Q3 2021 close
In the third quarter alone, Marriott opened 60 new hotels/7,882 rooms accounting for 30% of all new hotel rooms that opened in the U.S.

Hotel Facilities | Oct 28, 2021
At the end of Q3 2021, Dallas tops the U.S. hotel construction pipeline
The top 25 U.S. markets account for 33% of all pipeline projects and 37% of all rooms in the U.S. hotel construction pipeline.
Market Data | Oct 27, 2021
Only 14 states and D.C. added construction jobs since the pandemic began
Supply problems, lack of infrastructure bill undermine recovery.

Market Data | Oct 26, 2021
U.S. construction pipeline experiences highs and lows in the third quarter
Renovation and conversion pipeline activity remains steady at the end of Q3 ‘21, with conversion projects hitting a cyclical peak, and ending the quarter at 752 projects/79,024 rooms.

Market Data | Oct 19, 2021
Demand for design services continues to increase
The Architecture Billings Index (ABI) score for September was 56.6.


