

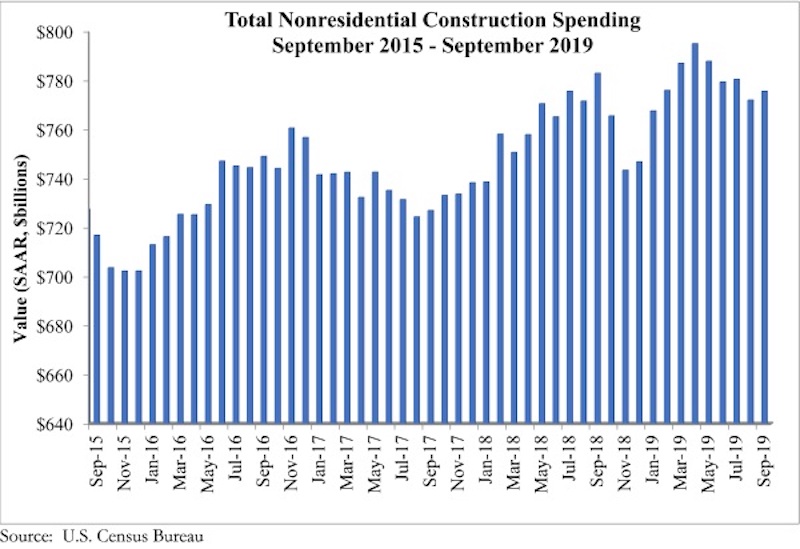
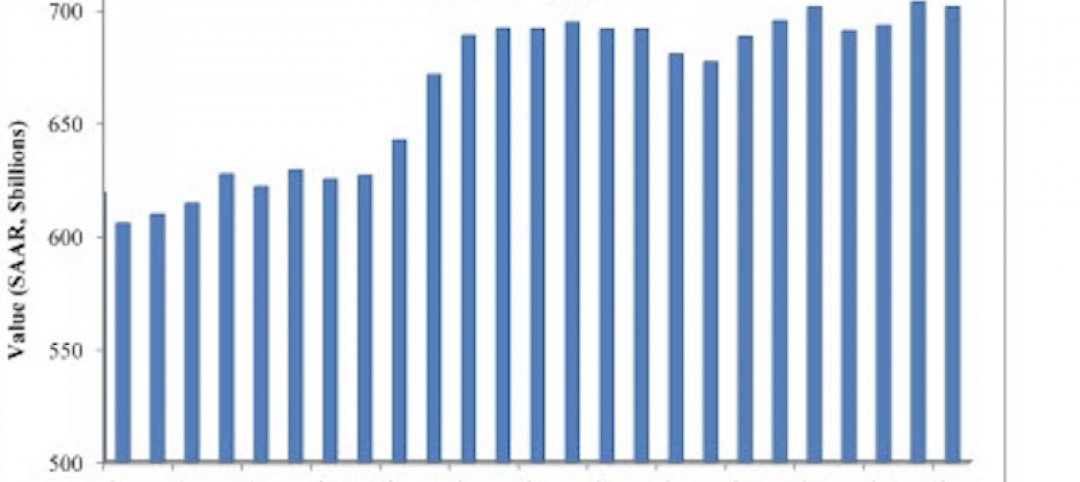
National nonresidential construction spending rose 0.5% in September but is down 0.9% on a year-ago basis, according to an Associated Builders and Contractors analysis of data published today by the U.S. Census Bureau. On a seasonally adjusted annualized basis, spending totaled $775.6 billion, 2.4% lower than the cyclical peak in April 2019.
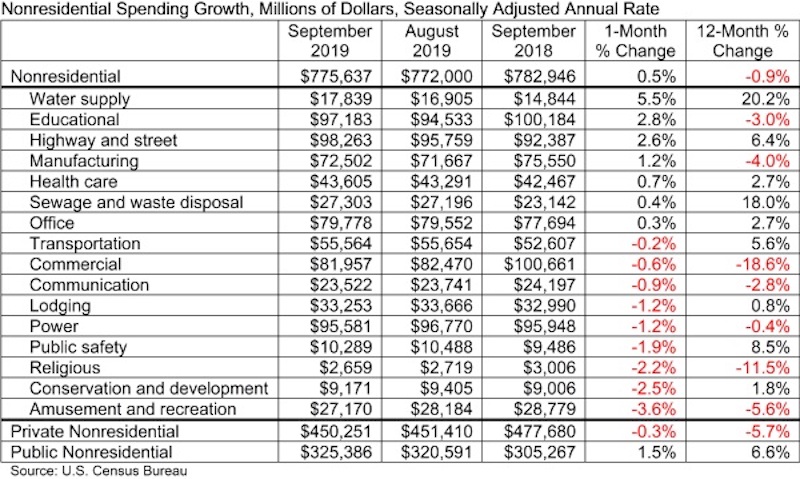
Private nonresidential spending fell 0.3% on a monthly basis and is down 5.7% compared to the same time last year, while public nonresidential construction spending expanded 1.5% for the month and is up 6.6% for the year. This comports neatly with today’s employment report and GDP data released earlier this week, which revealed ongoing growth in outlays for infrastructure but declining investment in structures.
“Construction spending contracted in a number of private segments, including in the commercial and lodging categories,” said ABC Chief Economist Anirban Basu. "While it would be easy to attribute this to a slowing economy and/or growing concerns regarding the saturation of available space in certain private segments, there are also large-scale economic transformations playing a role. Commercial construction spending is down nearly 19%, as traditional retailers continue to contend with the growing presence and capabilities of e-commerce giants, while those in the lodging segment—which dipped in September and is essentially flat year-over-year—are increasingly competing with online platforms such as Airbnb.
“Meanwhile, public construction remains one of the strongest elements of the U.S. economy,” said Basu. “Spending in the water supply category surged nearly 6% in September and is up 20% on a year-over-year basis. Overall, public nonresidential construction is up nearly 7% over the past 12 months as state and local government finances enjoy their best health in more than a decade. While there were some declines on a monthly basis in certain public segments in September, year-over-year spending is up more than 6% in the highway/street category, by nearly 6% in the transportation segment and by nearly 9% in the public safety category.
“Leading indicators, including the Architecture Billings Index, continue to point toward sluggish growth or worse in private construction,” said Basu. “Public construction spending, by contrast, should remain a source of economic expansion during the months ahead, but the looming insolvency of the Highway Trust Fund must be addressed soon for momentum to persist. In September, nine of 16 nonresidential construction segments experienced a decline in spending, and there has been a negative trend in place since April. Accordingly, viewed from a high-level perspective, the outlook for nonresidential construction spending is becoming increasingly uncertain, though available data regarding backlog suggest that the industry will enter 2020 with residual momentum.”

Related Stories

Market Data | Sep 22, 2016
Architecture Billings Index slips, overall outlook remains positive
Business conditions are slumping in the Northeast.
Market Data | Sep 20, 2016
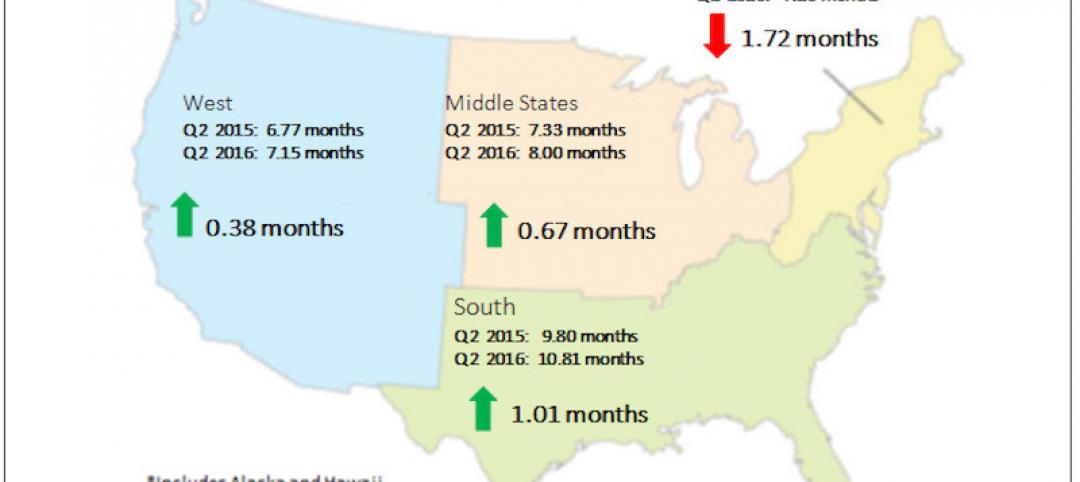
Backlog skyrockets for largest firms during second quarter, but falls to 8.5 months overall
While a handful of commercial construction segments continue to be associated with expanding volumes, for the most part, the average contractor is no longer getting busier, says ABC Chief Economist Anirban Basu.
Designers | Sep 13, 2016
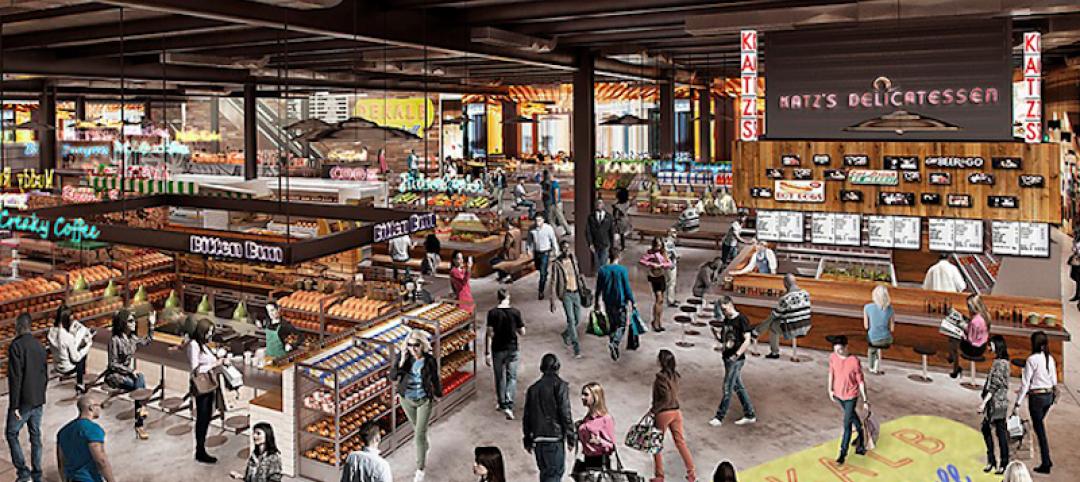
5 trends propelling a new era of food halls
Food halls have not only become an economical solution for restauranteurs and chefs experiencing skyrocketing retail prices and rents in large cities, but they also tap into our increased interest in gourmet locally sourced food, writes Gensler's Toshi Kasai.
Building Team | Sep 6, 2016
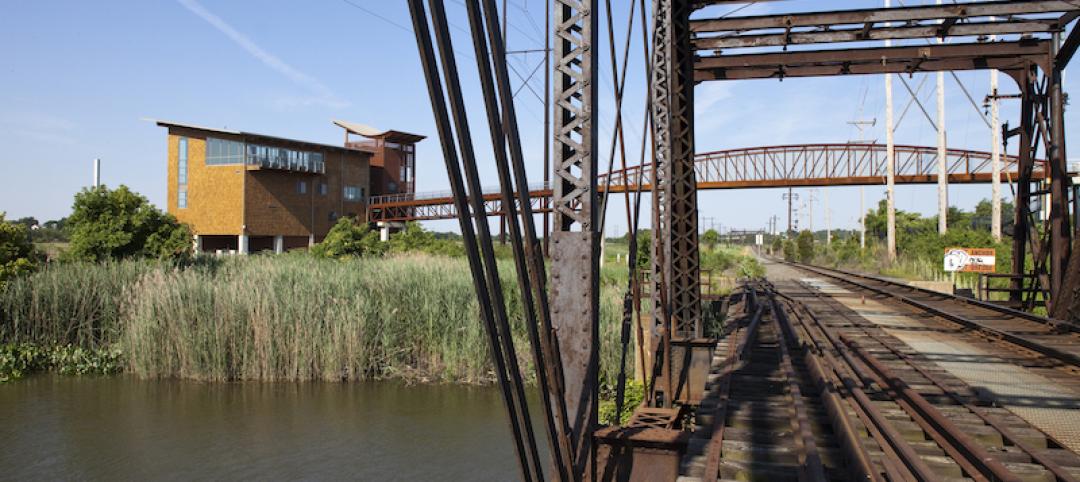
Letting your resource take center stage: A guide to thoughtful site selection for interpretive centers
Thoughtful site selection is never about one factor, but rather a confluence of several components that ultimately present trade-offs for the owner.
Market Data | Sep 2, 2016
Nonresidential spending inches lower in July while June data is upwardly revised to eight-year record
Nonresidential construction spending has been suppressed over the last year or so with the primary factor being the lack of momentum in public spending.

Industry Research | Sep 1, 2016
CannonDesign releases infographic to better help universities obtain more R&D funding
CannonDesign releases infographic to better help universities obtain more R&D funding.

Industry Research | Aug 25, 2016
Building bonds: The role of 'trusted advisor' is earned not acquired
A trusted advisor acts as a guiding partner over the full course of a professional relationship.
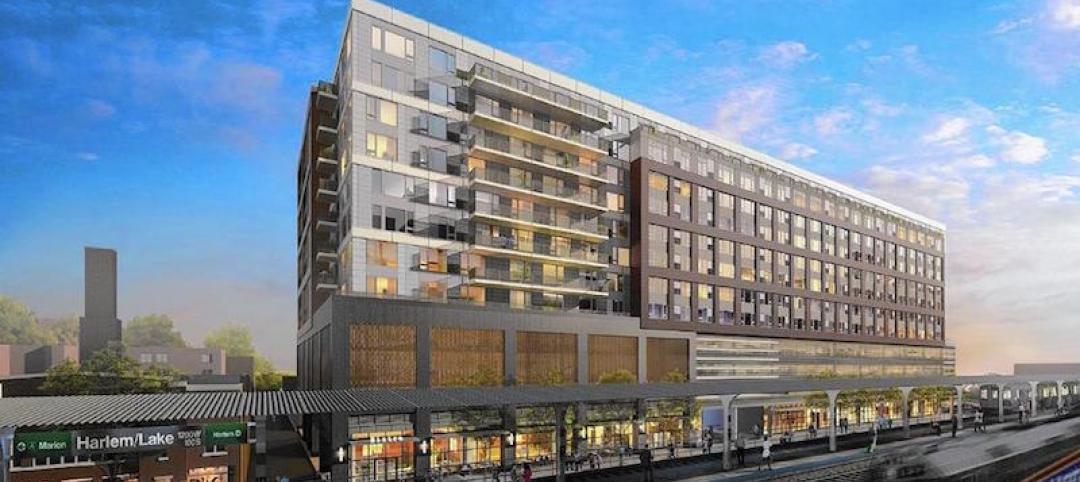
Multifamily Housing | Aug 17, 2016
A new research platform launches for a data-deprived multifamily sector
The list of leading developers, owners, and property managers that are funding the NMHC Research Foundation speaks to the information gap it hopes to fill.
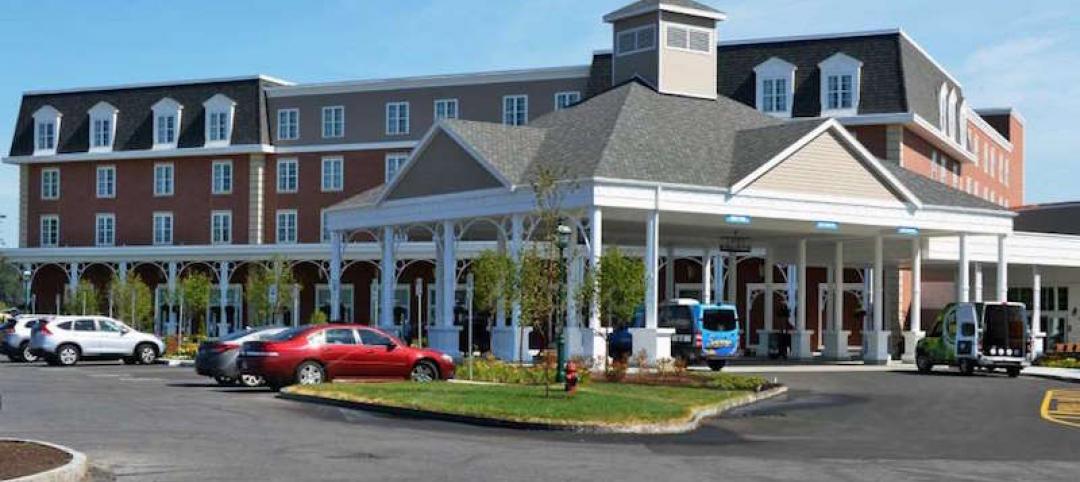
Hotel Facilities | Aug 17, 2016
Hotel construction continues to flourish in major cities
But concerns about overbuilding persist.
Market Data | Aug 16, 2016
Leading economists predict construction industry growth through 2017
The Chief Economists for ABC, AIA, and NAHB all see the construction industry continuing to expand over the next year and a half.


