

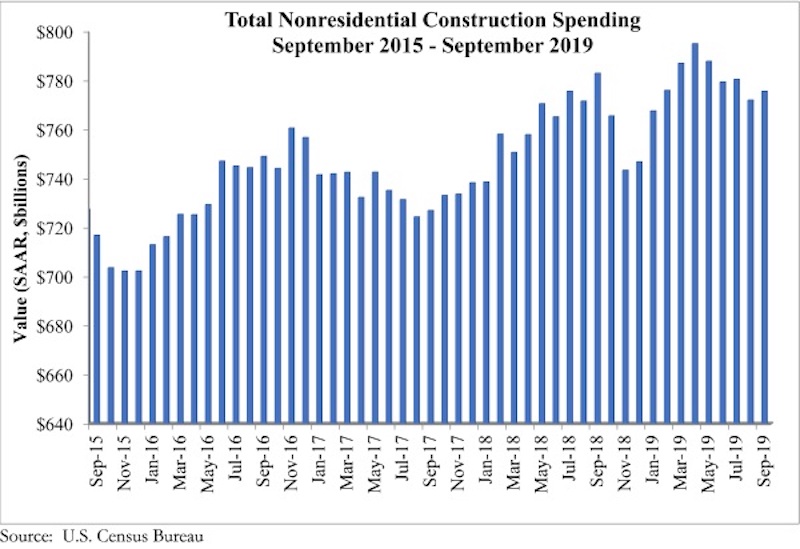
National nonresidential construction spending rose 0.5% in September but is down 0.9% on a year-ago basis, according to an Associated Builders and Contractors analysis of data published today by the U.S. Census Bureau. On a seasonally adjusted annualized basis, spending totaled $775.6 billion, 2.4% lower than the cyclical peak in April 2019.
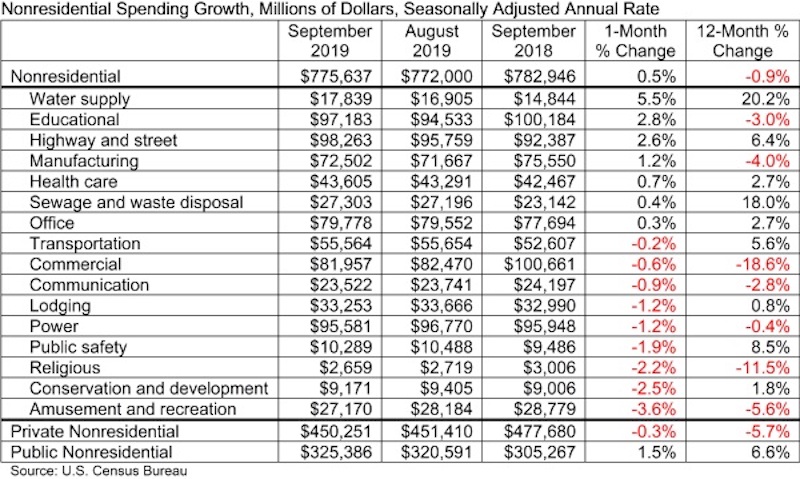
Private nonresidential spending fell 0.3% on a monthly basis and is down 5.7% compared to the same time last year, while public nonresidential construction spending expanded 1.5% for the month and is up 6.6% for the year. This comports neatly with today’s employment report and GDP data released earlier this week, which revealed ongoing growth in outlays for infrastructure but declining investment in structures.
“Construction spending contracted in a number of private segments, including in the commercial and lodging categories,” said ABC Chief Economist Anirban Basu. "While it would be easy to attribute this to a slowing economy and/or growing concerns regarding the saturation of available space in certain private segments, there are also large-scale economic transformations playing a role. Commercial construction spending is down nearly 19%, as traditional retailers continue to contend with the growing presence and capabilities of e-commerce giants, while those in the lodging segment—which dipped in September and is essentially flat year-over-year—are increasingly competing with online platforms such as Airbnb.
“Meanwhile, public construction remains one of the strongest elements of the U.S. economy,” said Basu. “Spending in the water supply category surged nearly 6% in September and is up 20% on a year-over-year basis. Overall, public nonresidential construction is up nearly 7% over the past 12 months as state and local government finances enjoy their best health in more than a decade. While there were some declines on a monthly basis in certain public segments in September, year-over-year spending is up more than 6% in the highway/street category, by nearly 6% in the transportation segment and by nearly 9% in the public safety category.
“Leading indicators, including the Architecture Billings Index, continue to point toward sluggish growth or worse in private construction,” said Basu. “Public construction spending, by contrast, should remain a source of economic expansion during the months ahead, but the looming insolvency of the Highway Trust Fund must be addressed soon for momentum to persist. In September, nine of 16 nonresidential construction segments experienced a decline in spending, and there has been a negative trend in place since April. Accordingly, viewed from a high-level perspective, the outlook for nonresidential construction spending is becoming increasingly uncertain, though available data regarding backlog suggest that the industry will enter 2020 with residual momentum.”

Related Stories

Construction Costs | May 16, 2024
New download: BD+C's May 2024 Market Intelligence Report
Building Design+Construction's monthly Market Intelligence Report offers a snapshot of the health of the U.S. building construction industry, including the commercial, multifamily, institutional, and industrial building sectors. This report tracks the latest metrics related to construction spending, demand for design services, contractor backlogs, and material price trends.

Contractors | May 15, 2024
The average U.S. contractor has 8.4 months worth of construction work in the pipeline, as of April 2024
Associated Builders and Contractors reported that its Construction Backlog Indicator increased to 8.4 months in April, according to an ABC member survey conducted April 22 to May 6. The reading is down 0.5 months from April 2023, but expanded 0.2 months from the prior month.

Healthcare Facilities | May 6, 2024
Hospital construction costs for 2024
Data from Gordian breaks down the average cost per square foot for a three-story hospital across 10 U.S. cities.

Contractors | May 1, 2024
Nonresidential construction spending rises 0.2% in March 2024 to $1.19 trillion
National nonresidential construction spending increased 0.2% in March, according to an Associated Builders and Contractors analysis of data published today by the U.S. Census Bureau. On a seasonally adjusted annualized basis, nonresidential spending totaled $1.19 trillion.

AEC Tech | Apr 30, 2024
Lack of organizational readiness is biggest hurdle to artificial intelligence adoption
Managers of companies in the industrial sector, including construction, have bought the hype of artificial intelligence (AI) as a transformative technology, but their organizations are not ready to realize its promise, according to research from IFS, a global cloud enterprise software company. An IFS survey of 1,700 senior decision-makers found that 84% of executives anticipate massive organizational benefits from AI.

Hotel Facilities | Apr 24, 2024
The U.S. hotel construction market sees record highs in the first quarter of 2024
As seen in the Q1 2024 U.S. Hotel Construction Pipeline Trend Report from Lodging Econometrics (LE), at the end of the first quarter, there are 6,065 projects with 702,990 rooms in the pipeline. This new all-time high represents a 9% year-over-year (YOY) increase in projects and a 7% YOY increase in rooms compared to last year.

Construction Costs | Apr 18, 2024
New download: BD+C's April 2024 Market Intelligence Report
Building Design+Construction's monthly Market Intelligence Report offers a snapshot of the health of the U.S. building construction industry, including the commercial, multifamily, institutional, and industrial building sectors. This report tracks the latest metrics related to construction spending, demand for design services, contractor backlogs, and material price trends.

Market Data | Apr 16, 2024
The average U.S. contractor has 8.2 months worth of construction work in the pipeline, as of March 2024
Associated Builders and Contractors reported today that its Construction Backlog Indicator increased to 8.2 months in March from 8.1 months in February, according to an ABC member survey conducted March 20 to April 3. The reading is down 0.5 months from March 2023.

K-12 Schools | Apr 10, 2024
Surprise, surprise: Students excel in modernized K-12 school buildings
Too many of the nation’s school districts are having to make it work with less-than-ideal educational facilities. But at what cost to student performance and staff satisfaction?

Multifamily Housing | Apr 9, 2024
March reports record gains in multifamily rent growth in 20 months
Asking rents for multifamily units increased $8 during the month to $1,721; year-over-year growth grew 30 basis points to 0.9 percent—a normal seasonal growth pattern according to Yardi Matrix.


