

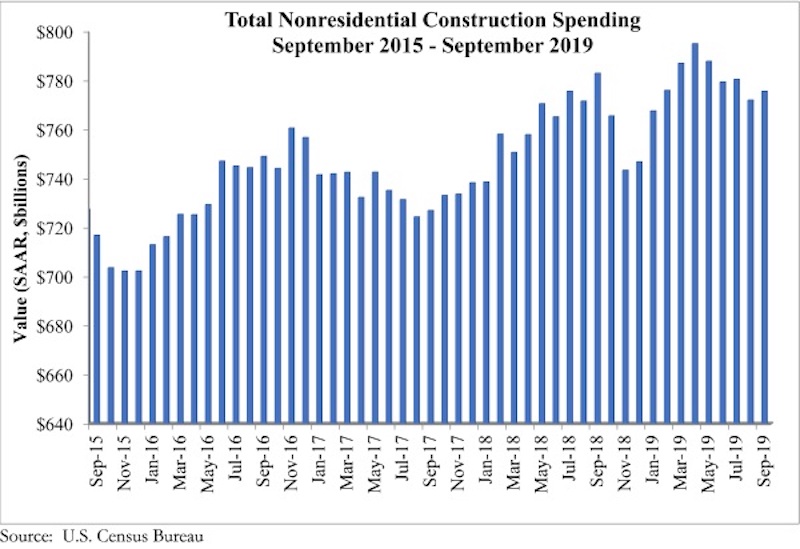
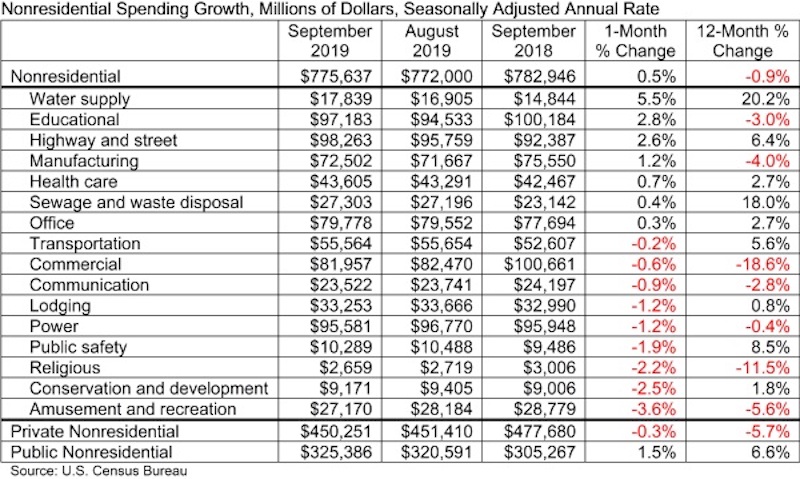
National nonresidential construction spending rose 0.5% in September but is down 0.9% on a year-ago basis, according to an Associated Builders and Contractors analysis of data published today by the U.S. Census Bureau. On a seasonally adjusted annualized basis, spending totaled $775.6 billion, 2.4% lower than the cyclical peak in April 2019.
Private nonresidential spending fell 0.3% on a monthly basis and is down 5.7% compared to the same time last year, while public nonresidential construction spending expanded 1.5% for the month and is up 6.6% for the year. This comports neatly with today’s employment report and GDP data released earlier this week, which revealed ongoing growth in outlays for infrastructure but declining investment in structures.
“Construction spending contracted in a number of private segments, including in the commercial and lodging categories,” said ABC Chief Economist Anirban Basu. "While it would be easy to attribute this to a slowing economy and/or growing concerns regarding the saturation of available space in certain private segments, there are also large-scale economic transformations playing a role. Commercial construction spending is down nearly 19%, as traditional retailers continue to contend with the growing presence and capabilities of e-commerce giants, while those in the lodging segment—which dipped in September and is essentially flat year-over-year—are increasingly competing with online platforms such as Airbnb.
“Meanwhile, public construction remains one of the strongest elements of the U.S. economy,” said Basu. “Spending in the water supply category surged nearly 6% in September and is up 20% on a year-over-year basis. Overall, public nonresidential construction is up nearly 7% over the past 12 months as state and local government finances enjoy their best health in more than a decade. While there were some declines on a monthly basis in certain public segments in September, year-over-year spending is up more than 6% in the highway/street category, by nearly 6% in the transportation segment and by nearly 9% in the public safety category.
“Leading indicators, including the Architecture Billings Index, continue to point toward sluggish growth or worse in private construction,” said Basu. “Public construction spending, by contrast, should remain a source of economic expansion during the months ahead, but the looming insolvency of the Highway Trust Fund must be addressed soon for momentum to persist. In September, nine of 16 nonresidential construction segments experienced a decline in spending, and there has been a negative trend in place since April. Accordingly, viewed from a high-level perspective, the outlook for nonresidential construction spending is becoming increasingly uncertain, though available data regarding backlog suggest that the industry will enter 2020 with residual momentum.”

Related Stories

Market Data | Nov 30, 2016
Marcum Commercial Construction Index reports industry outlook has shifted; more change expected
Overall nonresidential construction spending in September totaled $690.5 billion, down a slight 0.7 percent from a year earlier.

Industry Research | Nov 30, 2016
Multifamily millennials: Here is what millennial renters want in 2017
It’s all about technology and convenience when it comes to the things millennial renters value most in a multifamily facility.
Market Data | Nov 29, 2016
It’s not just traditional infrastructure that requires investment
A national survey finds strong support for essential community buildings.

Industry Research | Nov 28, 2016
Building America: The Merit Shop Scorecard
ABC releases state rankings on policies affecting construction industry.

Multifamily Housing | Nov 28, 2016
Axiometrics predicts apartment deliveries will peak by mid 2017
New York is projected to lead the nation next year, thanks to construction delays in 2016

Market Data | Nov 22, 2016
Construction activity will slow next year: JLL
Risk, labor, and technology are impacting what gets built.

Market Data | Nov 17, 2016
Architecture Billings Index rebounds after two down months
Decline in new design contracts suggests volatility in design activity to persist.

Market Data | Nov 11, 2016
Brand marketing: Why the B2B world needs to embrace consumers
The relevance of brand recognition has always been debatable in the B2B universe. With notable exceptions like BASF, few manufacturers or industry groups see value in generating top-of-mind awareness for their products and services with consumers.

Industry Research | Nov 8, 2016
Austin, Texas wins ‘Top City’ in the Emerging Trends in Real Estate outlook
Austin was followed on the list by Dallas/Fort Worth, Texas and Portland, Ore.

Market Data | Nov 2, 2016
Nonresidential construction spending down in September, but August data upwardly revised
The government revised the August nonresidential construction spending estimate from $686.6 billion to $696.6 billion.


