


HomeUnion has released a list of the most and least affordable rental housing markets in the U.S. Chicago tops the list as the most affordable metro, while Oakland, Calif., is the most expensive rental market, based on rent-to-income ratios.
“With its low cost of living, relatively large housing inventory levels and high affordability, Chicago is an excellent market for residents entering the renting pool,” says Steve Hovland, Director of Research for HomeUnion. It’s is the only metro in the country where typical renters spend less than 20% of their annual income on housing. Emerging neighborhoods like Logan Square and other West Side locations have become increasingly popular areas for young professionals, making Chicago an excellent choice for millennials.
The second location on HomeUnion’s list – Charlotte, N.C. – also has a low cost of living and high affordability, with average annual rents of under $16,000. “About one-quarter of the average income of a typical Charlotte resident goes to rental housing, making it appealing to millennials as well,” says Hovland.
Here’s a list of the 10 most affordable rental markets in the nation:
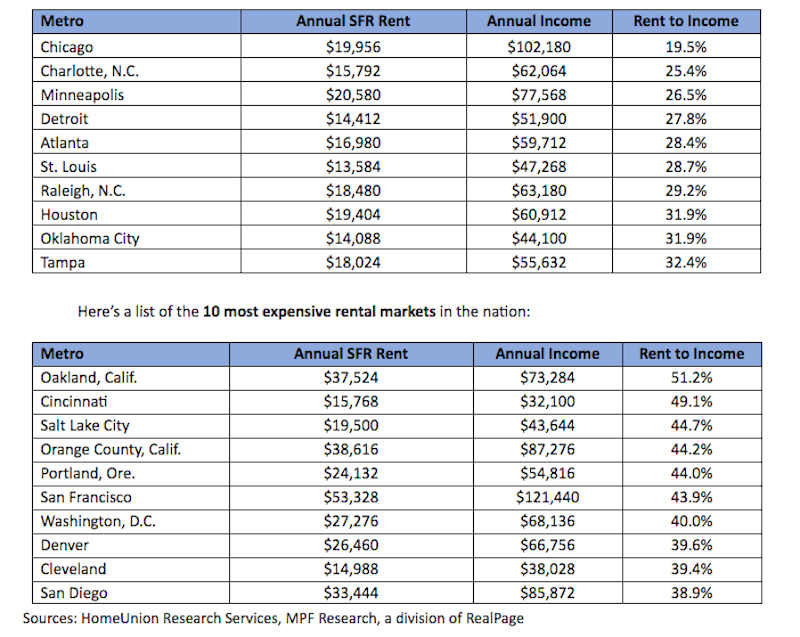
“Low affordability negatively impacts all renters in the Bay Area, Denver, Southern California and Washington, D.C., because of strong local job market conditions, intense demand for rental properties, and high mortgage costs for owner-occupied housing,” Hovland says.
Established and mature markets, such as Cincinnati and Cleveland, where home prices remain affordable, negatively impact renters’ wallets. “A significant number of potential young renters are migrating out of Ohio to Chicago or booming western metros such as Denver, the Bay Area and Los Angeles, leaving mostly low-wage earners to occupy rentals,” Hovland concludes.
Related Stories

Market Data | Nov 30, 2016
Marcum Commercial Construction Index reports industry outlook has shifted; more change expected
Overall nonresidential construction spending in September totaled $690.5 billion, down a slight 0.7 percent from a year earlier.

Industry Research | Nov 30, 2016
Multifamily millennials: Here is what millennial renters want in 2017
It’s all about technology and convenience when it comes to the things millennial renters value most in a multifamily facility.
Market Data | Nov 29, 2016
It’s not just traditional infrastructure that requires investment
A national survey finds strong support for essential community buildings.

Industry Research | Nov 28, 2016
Building America: The Merit Shop Scorecard
ABC releases state rankings on policies affecting construction industry.

Multifamily Housing | Nov 28, 2016
Axiometrics predicts apartment deliveries will peak by mid 2017
New York is projected to lead the nation next year, thanks to construction delays in 2016

Market Data | Nov 22, 2016
Construction activity will slow next year: JLL
Risk, labor, and technology are impacting what gets built.

Market Data | Nov 17, 2016
Architecture Billings Index rebounds after two down months
Decline in new design contracts suggests volatility in design activity to persist.

Market Data | Nov 11, 2016
Brand marketing: Why the B2B world needs to embrace consumers
The relevance of brand recognition has always been debatable in the B2B universe. With notable exceptions like BASF, few manufacturers or industry groups see value in generating top-of-mind awareness for their products and services with consumers.

Industry Research | Nov 8, 2016
Austin, Texas wins ‘Top City’ in the Emerging Trends in Real Estate outlook
Austin was followed on the list by Dallas/Fort Worth, Texas and Portland, Ore.

Market Data | Nov 2, 2016
Nonresidential construction spending down in September, but August data upwardly revised
The government revised the August nonresidential construction spending estimate from $686.6 billion to $696.6 billion.


