


HomeUnion has released a list of the most and least affordable rental housing markets in the U.S. Chicago tops the list as the most affordable metro, while Oakland, Calif., is the most expensive rental market, based on rent-to-income ratios.
“With its low cost of living, relatively large housing inventory levels and high affordability, Chicago is an excellent market for residents entering the renting pool,” says Steve Hovland, Director of Research for HomeUnion. It’s is the only metro in the country where typical renters spend less than 20% of their annual income on housing. Emerging neighborhoods like Logan Square and other West Side locations have become increasingly popular areas for young professionals, making Chicago an excellent choice for millennials.
The second location on HomeUnion’s list – Charlotte, N.C. – also has a low cost of living and high affordability, with average annual rents of under $16,000. “About one-quarter of the average income of a typical Charlotte resident goes to rental housing, making it appealing to millennials as well,” says Hovland.
Here’s a list of the 10 most affordable rental markets in the nation:
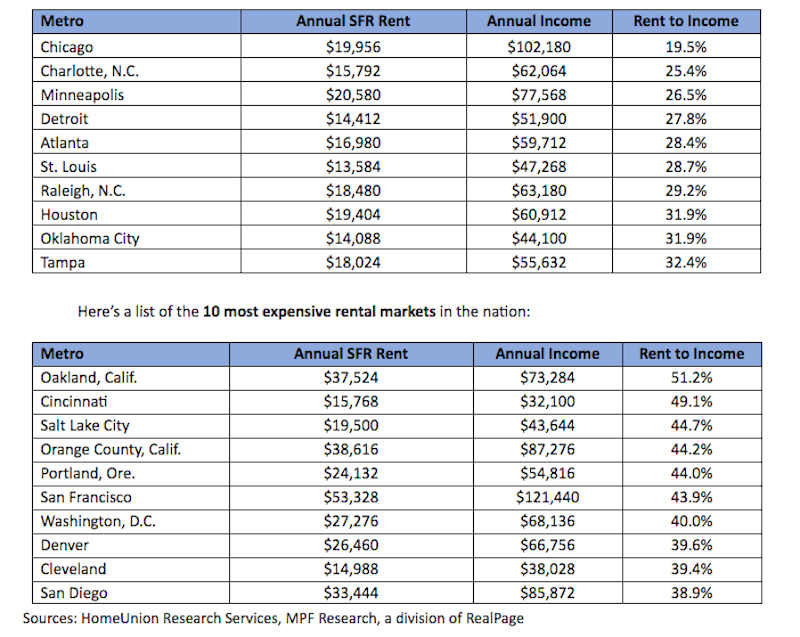
“Low affordability negatively impacts all renters in the Bay Area, Denver, Southern California and Washington, D.C., because of strong local job market conditions, intense demand for rental properties, and high mortgage costs for owner-occupied housing,” Hovland says.
Established and mature markets, such as Cincinnati and Cleveland, where home prices remain affordable, negatively impact renters’ wallets. “A significant number of potential young renters are migrating out of Ohio to Chicago or booming western metros such as Denver, the Bay Area and Los Angeles, leaving mostly low-wage earners to occupy rentals,” Hovland concludes.
Related Stories

Industry Research | Jun 26, 2017
Time to earn an architecture license continues to drop
This trend is driven by candidates completing the experience and examination programs concurrently and more quickly.

Industry Research | Jun 22, 2017
ABC's Construction Backlog Indicator rebounds in 2017
The first quarter showed gains in all categories.

Market Data | Jun 21, 2017
Design billings maintain solid footing, strong momentum reflected in project inquiries/design contracts
Balanced growth results in billings gains in all sectors.

Market Data | Jun 16, 2017
Residential construction was strong, but not enough, in 2016
The Joint Center for Housing Studies’ latest report expects minorities and millennials to account for the lion’s share of household formations through 2035.

Industry Research | Jun 15, 2017
Commercial Construction Index indicates high revenue and employment expectations for 2017
USG Corporation (USG) and U.S. Chamber of Commerce release survey results gauging confidence among industry leaders.

Market Data | Jun 2, 2017
Nonresidential construction spending falls in 13 of 16 segments in April
Nonresidential construction spending fell 1.7% in April 2017, totaling $696.3 billion on a seasonally adjusted, annualized basis, according to analysis of U.S. Census Bureau data released today by Associated Builders and Contractors.

Industry Research | May 25, 2017
Project labor agreement mandates inflate cost of construction 13%
Ohio schools built under government-mandated project labor agreements (PLAs) cost 13.12 percent more than schools that were bid and constructed through fair and open competition.

Market Data | May 24, 2017
Design billings increasing entering height of construction season
All regions report positive business conditions.

Market Data | May 24, 2017
The top franchise companies in the construction pipeline
3 franchise companies comprise 65% of all rooms in the Total Pipeline.

Industry Research | May 24, 2017
These buildings paid the highest property taxes in 2016
Office buildings dominate the list, but a residential community climbed as high as number two on the list.


