


HomeUnion has released a list of the most and least affordable rental housing markets in the U.S. Chicago tops the list as the most affordable metro, while Oakland, Calif., is the most expensive rental market, based on rent-to-income ratios.
“With its low cost of living, relatively large housing inventory levels and high affordability, Chicago is an excellent market for residents entering the renting pool,” says Steve Hovland, Director of Research for HomeUnion. It’s is the only metro in the country where typical renters spend less than 20% of their annual income on housing. Emerging neighborhoods like Logan Square and other West Side locations have become increasingly popular areas for young professionals, making Chicago an excellent choice for millennials.
The second location on HomeUnion’s list – Charlotte, N.C. – also has a low cost of living and high affordability, with average annual rents of under $16,000. “About one-quarter of the average income of a typical Charlotte resident goes to rental housing, making it appealing to millennials as well,” says Hovland.
Here’s a list of the 10 most affordable rental markets in the nation:
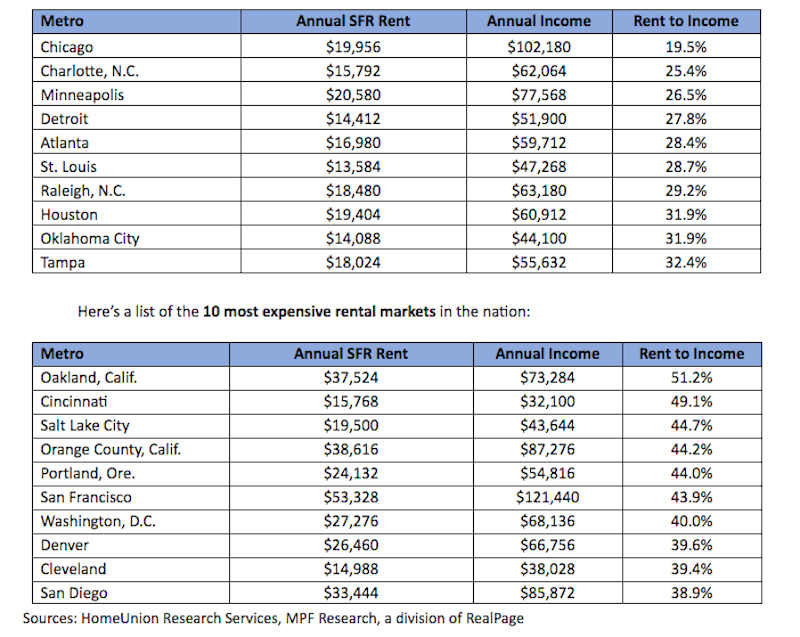
“Low affordability negatively impacts all renters in the Bay Area, Denver, Southern California and Washington, D.C., because of strong local job market conditions, intense demand for rental properties, and high mortgage costs for owner-occupied housing,” Hovland says.
Established and mature markets, such as Cincinnati and Cleveland, where home prices remain affordable, negatively impact renters’ wallets. “A significant number of potential young renters are migrating out of Ohio to Chicago or booming western metros such as Denver, the Bay Area and Los Angeles, leaving mostly low-wage earners to occupy rentals,” Hovland concludes.
Related Stories

Market Data | Mar 29, 2017
Contractor confidence ends 2016 down but still in positive territory
Although all three diffusion indices in the survey fell by more than five points they remain well above the threshold of 50, which signals that construction activity will continue to be one of the few significant drivers of economic growth.

Market Data | Mar 24, 2017
These are the most and least innovative states for 2017
Connecticut, Virginia, and Maryland are all in the top 10 most innovative states, but none of them were able to claim the number one spot.

Market Data | Mar 22, 2017
After a strong year, construction industry anxious about Washington’s proposed policy shifts
Impacts on labor and materials costs at issue, according to latest JLL report.

Market Data | Mar 22, 2017
Architecture Billings Index rebounds into positive territory
Business conditions projected to solidify moving into the spring and summer.

Market Data | Mar 15, 2017
ABC's Construction Backlog Indicator fell to end 2016
Contractors in each segment surveyed all saw lower backlog during the fourth quarter, with firms in the heavy industrial segment experiencing the largest drop.

Market Data | Feb 28, 2017
Leopardo’s 2017 Construction Economics Report shows year-over-year construction spending increase of 4.2%
The pace of growth was slower than in 2015, however.

Market Data | Feb 23, 2017
Entering 2017, architecture billings slip modestly
Despite minor slowdown in overall billings, commercial/ industrial and institutional sectors post strongest gains in over 12 months.

Market Data | Feb 16, 2017
How does your hospital stack up? Grumman/Butkus Associates 2016 Hospital Benchmarking Survey
Report examines electricity, fossil fuel, water/sewer, and carbon footprint.

Market Data | Feb 1, 2017
Nonresidential spending falters slightly to end 2016
Nonresidential spending decreased from $713.1 billion in November to $708.2 billion in December.

Market Data | Jan 31, 2017
AIA foresees nonres building spending increasing, but at a slower pace than in 2016
Expects another double-digit growth year for office construction, but a more modest uptick for health-related building.


