


HomeUnion has released a list of the most and least affordable rental housing markets in the U.S. Chicago tops the list as the most affordable metro, while Oakland, Calif., is the most expensive rental market, based on rent-to-income ratios.
“With its low cost of living, relatively large housing inventory levels and high affordability, Chicago is an excellent market for residents entering the renting pool,” says Steve Hovland, Director of Research for HomeUnion. It’s is the only metro in the country where typical renters spend less than 20% of their annual income on housing. Emerging neighborhoods like Logan Square and other West Side locations have become increasingly popular areas for young professionals, making Chicago an excellent choice for millennials.
The second location on HomeUnion’s list – Charlotte, N.C. – also has a low cost of living and high affordability, with average annual rents of under $16,000. “About one-quarter of the average income of a typical Charlotte resident goes to rental housing, making it appealing to millennials as well,” says Hovland.
Here’s a list of the 10 most affordable rental markets in the nation:
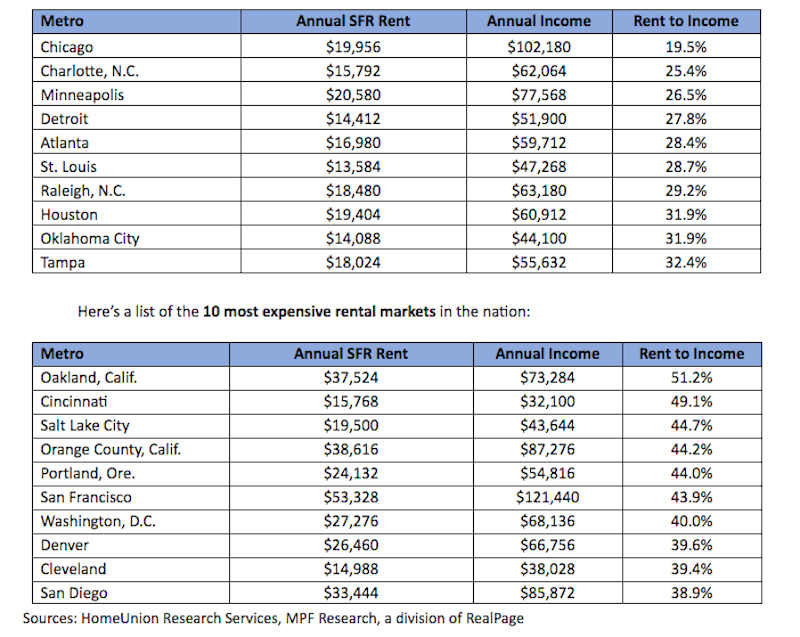
“Low affordability negatively impacts all renters in the Bay Area, Denver, Southern California and Washington, D.C., because of strong local job market conditions, intense demand for rental properties, and high mortgage costs for owner-occupied housing,” Hovland says.
Established and mature markets, such as Cincinnati and Cleveland, where home prices remain affordable, negatively impact renters’ wallets. “A significant number of potential young renters are migrating out of Ohio to Chicago or booming western metros such as Denver, the Bay Area and Los Angeles, leaving mostly low-wage earners to occupy rentals,” Hovland concludes.
Related Stories

Market Data | Aug 2, 2017
Nonresidential Construction Spending falls in June, driven by public sector
June’s weak construction spending report can be largely attributed to the public sector.

Market Data | Jul 31, 2017
U.S. economic growth accelerates in second quarter; Nonresidential fixed investment maintains momentum
Nonresidential fixed investment, a category of GDP embodying nonresidential construction activity, expanded at a 5.2% seasonally adjusted annual rate.

Multifamily Housing | Jul 27, 2017
Apartment market index: Business conditions soften, but still solid
Despite some softness at the high end of the apartment market, demand for apartments will continue to be substantial for years to come, according to the National Multifamily Housing Council.

Market Data | Jul 25, 2017
What's your employer value proposition?
Hiring and retaining talent is one of the top challenges faced by most professional services firms.

Market Data | Jul 25, 2017
Moderating economic growth triggers construction forecast downgrade for 2017 and 2018
Prospects for the construction industry have weakened with developments over the first half of the year.

Industry Research | Jul 6, 2017
The four types of strategic real estate amenities
From swimming pools to pirate ships, amenities (even crazy ones) aren’t just perks, but assets to enhance performance.
Market Data | Jun 29, 2017
Silicon Valley, Long Island among the priciest places for office fitouts
Coming out on top as the most expensive market to build out an office is Silicon Valley, Calif., with an out-of-pocket cost of $199.22.

Market Data | Jun 26, 2017
Construction disputes were slightly less contentious last year
But poorly written and administered contracts are still problems, says latest Arcadis report.

Industry Research | Jun 26, 2017
Time to earn an architecture license continues to drop
This trend is driven by candidates completing the experience and examination programs concurrently and more quickly.

Industry Research | Jun 22, 2017
ABC's Construction Backlog Indicator rebounds in 2017
The first quarter showed gains in all categories.


