


Grumman/Butkus Associates, a firm of energy efficiency consultants and sustainable design engineers, recently released the results of its 2019 Hospital Energy and Water Benchmarking Survey, focusing on healthcare facilities’ resource usage trends and costs for calendar year 2018.
Since G/BA initiated the survey more than 20 years ago, hospitals’ overall fossil fuel use has trended downward, but electricity use isn’t declining as much. The average combined Btu/ft2 (electricity plus gas/steam) for participating facilities was 245,258 in this year’s survey, up from 241,733 in CY2017.
Square-foot prices for gas/steam fell modestly ($0.74 in 2918, compared with $0.75 in 2017), but square-foot prices for electricity climbed rose sharply ($2.57 in 2018, compared with $2.41 in 2017). The overall result is that hospitals’ total ft2 costs for energy (gas/steam plus electric) increased: $3.31 for 2018, compared with $3.16 for 2017.
Hospitals’ average carbon footprint has remained fairly steady at 50 to 60 pounds of CO2 equivalent per ft2 per year since G/BA began calculating carbon data in 1999. “If we are going to address the very daunting issue of climate change, the healthcare industry must make greater strides in reducing its carbon footprint,” says Dan Doyle, G/BA Chairman. “As the trend data shows, not enough progress is being made so far.”
Participating facilities displayed a broad range of usage patterns. For instance, some participants are using more than 250,000 BTU/ft2 in fossil fuel annually, compared with a general mid-range of facilities (about 140,000 BTU/ft2/year) and those that used least (75,000 BTU/ft2/year or less). Similarly, a few hospitals consume more than 45 kWh/ft2/year in electricity, compared with a mid-range of about 30 kWh/ft2/year. A few squeaked by with less than 18 kWh/ft2/year.
 Hospitals’ energy costs per square foot (red boxes) rose in 2018. Energy use intensity (Btu/sf/year, blue bars) has drifted downward over time but also ticked up in 2018. Chart ©2020 Grumman/Butkus Associates.
“Facilities that have high unit costs for energy should view this as an opportunity,” says Doyle. “For example, an energy conservation project that would have a five-year payback at an ‘average’ facility may have a payback of just 2.5 or 3 years at a facility with higher unit costs for energy.”
Hospital water/sewer use is also gradually declining, currently averaging about 48 gallons per square foot per year (compared with more than 60 gallons/ ft2/year a decade ago). Costs for water/sewer are generally rising, however, now averaging $0.44 /ft2. “G/BA expects the trend of rising water and sewer costs to continue,” says Doyle. “Price hikes not only reflect increasing costs to extract and treat the water, but also the fact that cash-strapped governmental entities may view water as a revenue source. Costs to upgrade or replace aging infrastructure are also contributing to escalating costs”
Since 1995, the G/BA survey has provided a free annual benchmarking resource. Hospitals are invited to participate by submitting responses to a short list of questions. Information for this edition was provided by 125 hospitals located in Illinois (48), Wisconsin (18), Indiana (16), Michigan (15), Texas (13), and several other states.
Full results and analysis, as well as information about participating in the 2020 survey (2019 data), are available at the firm’s website: grummanbutkus.com/HES. For additional information, contact Dan Doyle (ddoyle@grummanbutkus.com) or Julie Higginbotham (jhigginbotham@grummanbutkus.
Related Stories

Market Data | Sep 22, 2016
Architecture Billings Index slips, overall outlook remains positive
Business conditions are slumping in the Northeast.
Market Data | Sep 20, 2016
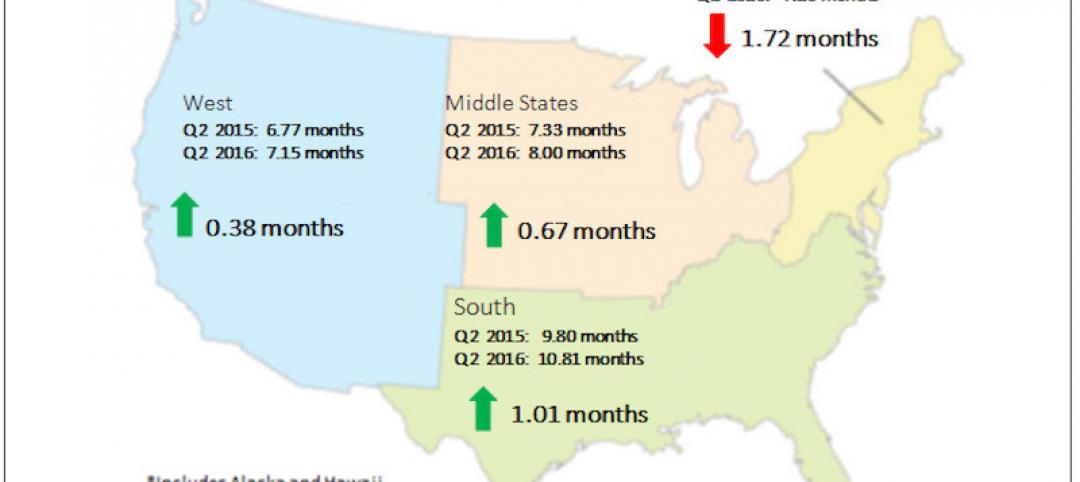
Backlog skyrockets for largest firms during second quarter, but falls to 8.5 months overall
While a handful of commercial construction segments continue to be associated with expanding volumes, for the most part, the average contractor is no longer getting busier, says ABC Chief Economist Anirban Basu.

Designers | Sep 13, 2016
5 trends propelling a new era of food halls
Food halls have not only become an economical solution for restauranteurs and chefs experiencing skyrocketing retail prices and rents in large cities, but they also tap into our increased interest in gourmet locally sourced food, writes Gensler's Toshi Kasai.
Building Team | Sep 6, 2016
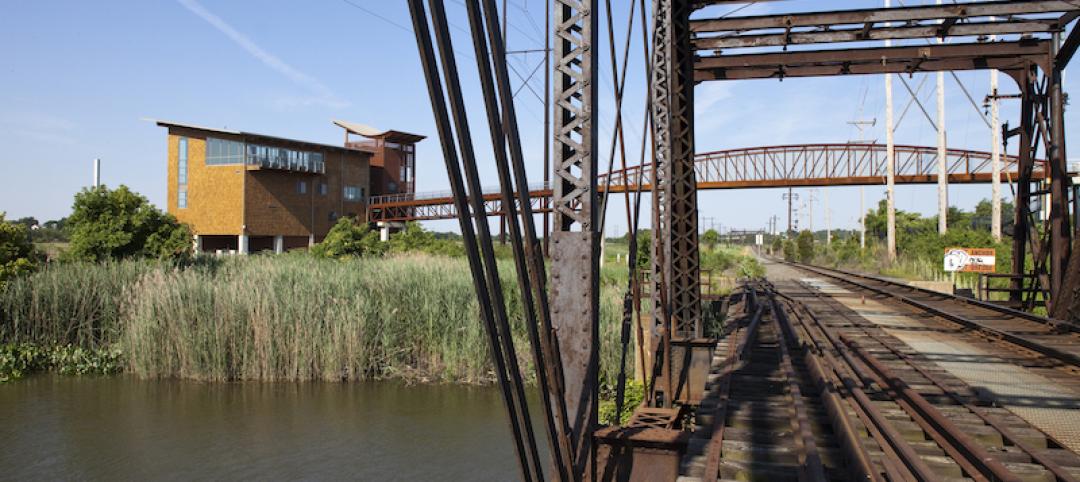
Letting your resource take center stage: A guide to thoughtful site selection for interpretive centers
Thoughtful site selection is never about one factor, but rather a confluence of several components that ultimately present trade-offs for the owner.
Market Data | Sep 2, 2016
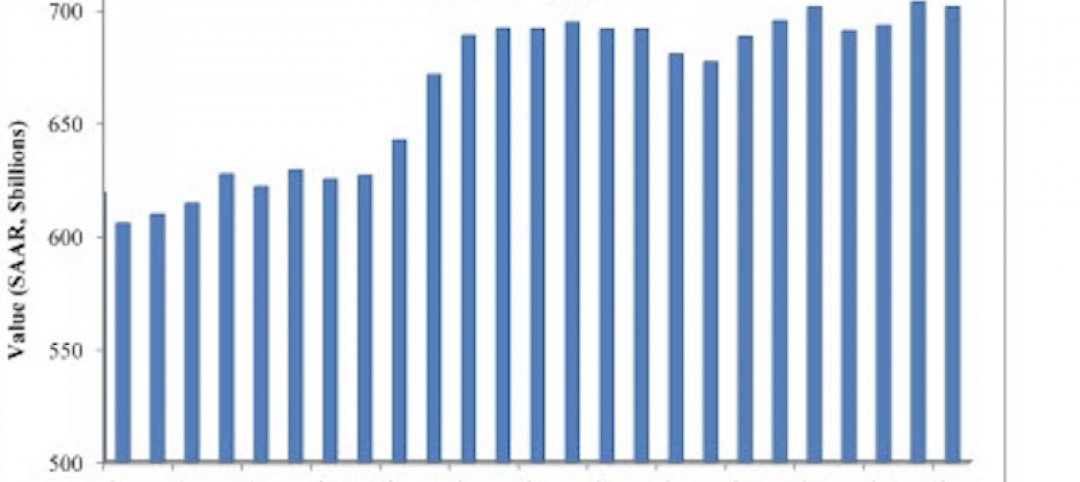
Nonresidential spending inches lower in July while June data is upwardly revised to eight-year record
Nonresidential construction spending has been suppressed over the last year or so with the primary factor being the lack of momentum in public spending.

Industry Research | Sep 1, 2016
CannonDesign releases infographic to better help universities obtain more R&D funding
CannonDesign releases infographic to better help universities obtain more R&D funding.

Industry Research | Aug 25, 2016
Building bonds: The role of 'trusted advisor' is earned not acquired
A trusted advisor acts as a guiding partner over the full course of a professional relationship.
Multifamily Housing | Aug 17, 2016
A new research platform launches for a data-deprived multifamily sector
The list of leading developers, owners, and property managers that are funding the NMHC Research Foundation speaks to the information gap it hopes to fill.
Hotel Facilities | Aug 17, 2016
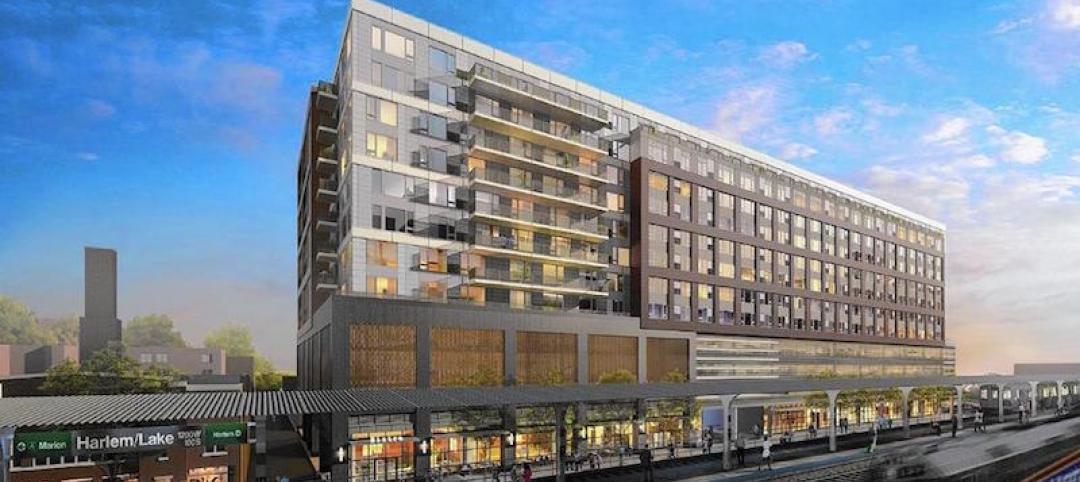
Hotel construction continues to flourish in major cities
But concerns about overbuilding persist.
Market Data | Aug 16, 2016
Leading economists predict construction industry growth through 2017
The Chief Economists for ABC, AIA, and NAHB all see the construction industry continuing to expand over the next year and a half.


