


Grumman/Butkus Associates, a firm of energy efficiency consultants and sustainable design engineers, recently released the results of its 2019 Hospital Energy and Water Benchmarking Survey, focusing on healthcare facilities’ resource usage trends and costs for calendar year 2018.
Since G/BA initiated the survey more than 20 years ago, hospitals’ overall fossil fuel use has trended downward, but electricity use isn’t declining as much. The average combined Btu/ft2 (electricity plus gas/steam) for participating facilities was 245,258 in this year’s survey, up from 241,733 in CY2017.
Square-foot prices for gas/steam fell modestly ($0.74 in 2918, compared with $0.75 in 2017), but square-foot prices for electricity climbed rose sharply ($2.57 in 2018, compared with $2.41 in 2017). The overall result is that hospitals’ total ft2 costs for energy (gas/steam plus electric) increased: $3.31 for 2018, compared with $3.16 for 2017.
Hospitals’ average carbon footprint has remained fairly steady at 50 to 60 pounds of CO2 equivalent per ft2 per year since G/BA began calculating carbon data in 1999. “If we are going to address the very daunting issue of climate change, the healthcare industry must make greater strides in reducing its carbon footprint,” says Dan Doyle, G/BA Chairman. “As the trend data shows, not enough progress is being made so far.”
Participating facilities displayed a broad range of usage patterns. For instance, some participants are using more than 250,000 BTU/ft2 in fossil fuel annually, compared with a general mid-range of facilities (about 140,000 BTU/ft2/year) and those that used least (75,000 BTU/ft2/year or less). Similarly, a few hospitals consume more than 45 kWh/ft2/year in electricity, compared with a mid-range of about 30 kWh/ft2/year. A few squeaked by with less than 18 kWh/ft2/year.
 Hospitals’ energy costs per square foot (red boxes) rose in 2018. Energy use intensity (Btu/sf/year, blue bars) has drifted downward over time but also ticked up in 2018. Chart ©2020 Grumman/Butkus Associates.
“Facilities that have high unit costs for energy should view this as an opportunity,” says Doyle. “For example, an energy conservation project that would have a five-year payback at an ‘average’ facility may have a payback of just 2.5 or 3 years at a facility with higher unit costs for energy.”
Hospital water/sewer use is also gradually declining, currently averaging about 48 gallons per square foot per year (compared with more than 60 gallons/ ft2/year a decade ago). Costs for water/sewer are generally rising, however, now averaging $0.44 /ft2. “G/BA expects the trend of rising water and sewer costs to continue,” says Doyle. “Price hikes not only reflect increasing costs to extract and treat the water, but also the fact that cash-strapped governmental entities may view water as a revenue source. Costs to upgrade or replace aging infrastructure are also contributing to escalating costs”
Since 1995, the G/BA survey has provided a free annual benchmarking resource. Hospitals are invited to participate by submitting responses to a short list of questions. Information for this edition was provided by 125 hospitals located in Illinois (48), Wisconsin (18), Indiana (16), Michigan (15), Texas (13), and several other states.
Full results and analysis, as well as information about participating in the 2020 survey (2019 data), are available at the firm’s website: grummanbutkus.com/HES. For additional information, contact Dan Doyle (ddoyle@grummanbutkus.com) or Julie Higginbotham (jhigginbotham@grummanbutkus.
Related Stories

Market Data | Jun 14, 2016
Transwestern: Market fundamentals and global stimulus driving economic growth
A new report from commercial real estate firm Transwestern indicates steady progress for the U.S. economy. Consistent job gains, wage growth, and consumer spending have offset declining corporate profits, and global stimulus plans appear to be effective.

Market Data | Jun 7, 2016
Global construction disputes took longer to resolve in 2015
The good news: the length and value of disputes in the U.S. fell last year, according to latest Arcadis report.

Market Data | Jun 3, 2016
JLL report: Retail renovation drives construction growth in 2016
Retail construction projects were up nearly 25% year-over-year, and the industrial and office construction sectors fared well, too. Economic uncertainty looms over everything, however.

Market Data | Jun 2, 2016
ABC: Nonresidential construction spending down in April
Lower building material prices, a sluggish U.S. economy, and hesitation among private developers all factor into the 2.1% drop.

Market Data | May 20, 2016
Report: Urban area population growth slows
Older Millennials are looking to buy homes and move away to more affordable suburbs and exurbs.
Market Data | May 17, 2016
Modest growth for AIA’s Architecture Billings Index in April
The American Institute of Architects reported the April ABI score was 50.6, down from the mark of 51.9 in the previous month. This score still reflects an increase in design services.

Market Data | Apr 29, 2016
ABC: Quarterly GDP growth slowest in two years
Bureau of Economic Analysis data indicates that the U.S. output is barely growing and that nonresidential investment is down.

Market Data | Apr 20, 2016
AIA: Architecture Billings Index ends first quarter on upswing
The multi-family residential sector fared the best. The Midwest was the only U.S. region that didn't see an increase in billings.
Building Technology | Apr 11, 2016
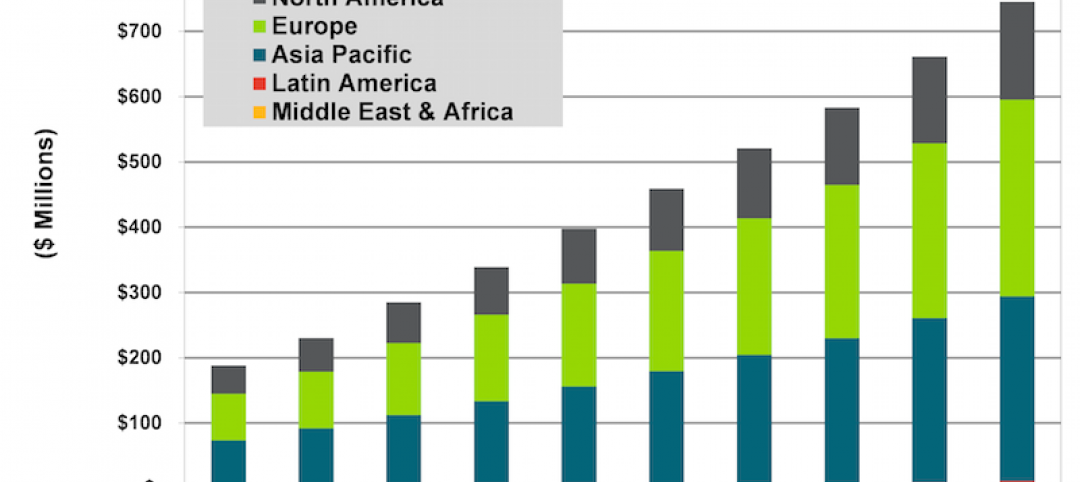
A nascent commercial wireless sensor market is poised to ascend in the next decade
Europe and Asia will propel that growth, according to a new report from Navigant.
Industry Research | Apr 7, 2016
CBRE provides latest insight into healthcare real estate investors’ strategies
Survey respondents are targeting smaller acquisitions, at a time when market cap rates are narrowing for different product types.


