


Grumman/Butkus Associates, a firm of energy efficiency consultants and sustainable design engineers, recently released the results of its 2019 Hospital Energy and Water Benchmarking Survey, focusing on healthcare facilities’ resource usage trends and costs for calendar year 2018.
Since G/BA initiated the survey more than 20 years ago, hospitals’ overall fossil fuel use has trended downward, but electricity use isn’t declining as much. The average combined Btu/ft2 (electricity plus gas/steam) for participating facilities was 245,258 in this year’s survey, up from 241,733 in CY2017.
Square-foot prices for gas/steam fell modestly ($0.74 in 2918, compared with $0.75 in 2017), but square-foot prices for electricity climbed rose sharply ($2.57 in 2018, compared with $2.41 in 2017). The overall result is that hospitals’ total ft2 costs for energy (gas/steam plus electric) increased: $3.31 for 2018, compared with $3.16 for 2017.
Hospitals’ average carbon footprint has remained fairly steady at 50 to 60 pounds of CO2 equivalent per ft2 per year since G/BA began calculating carbon data in 1999. “If we are going to address the very daunting issue of climate change, the healthcare industry must make greater strides in reducing its carbon footprint,” says Dan Doyle, G/BA Chairman. “As the trend data shows, not enough progress is being made so far.”
Participating facilities displayed a broad range of usage patterns. For instance, some participants are using more than 250,000 BTU/ft2 in fossil fuel annually, compared with a general mid-range of facilities (about 140,000 BTU/ft2/year) and those that used least (75,000 BTU/ft2/year or less). Similarly, a few hospitals consume more than 45 kWh/ft2/year in electricity, compared with a mid-range of about 30 kWh/ft2/year. A few squeaked by with less than 18 kWh/ft2/year.
 Hospitals’ energy costs per square foot (red boxes) rose in 2018. Energy use intensity (Btu/sf/year, blue bars) has drifted downward over time but also ticked up in 2018. Chart ©2020 Grumman/Butkus Associates.
“Facilities that have high unit costs for energy should view this as an opportunity,” says Doyle. “For example, an energy conservation project that would have a five-year payback at an ‘average’ facility may have a payback of just 2.5 or 3 years at a facility with higher unit costs for energy.”
Hospital water/sewer use is also gradually declining, currently averaging about 48 gallons per square foot per year (compared with more than 60 gallons/ ft2/year a decade ago). Costs for water/sewer are generally rising, however, now averaging $0.44 /ft2. “G/BA expects the trend of rising water and sewer costs to continue,” says Doyle. “Price hikes not only reflect increasing costs to extract and treat the water, but also the fact that cash-strapped governmental entities may view water as a revenue source. Costs to upgrade or replace aging infrastructure are also contributing to escalating costs”
Since 1995, the G/BA survey has provided a free annual benchmarking resource. Hospitals are invited to participate by submitting responses to a short list of questions. Information for this edition was provided by 125 hospitals located in Illinois (48), Wisconsin (18), Indiana (16), Michigan (15), Texas (13), and several other states.
Full results and analysis, as well as information about participating in the 2020 survey (2019 data), are available at the firm’s website: grummanbutkus.com/HES. For additional information, contact Dan Doyle (ddoyle@grummanbutkus.com) or Julie Higginbotham (jhigginbotham@grummanbutkus.
Related Stories
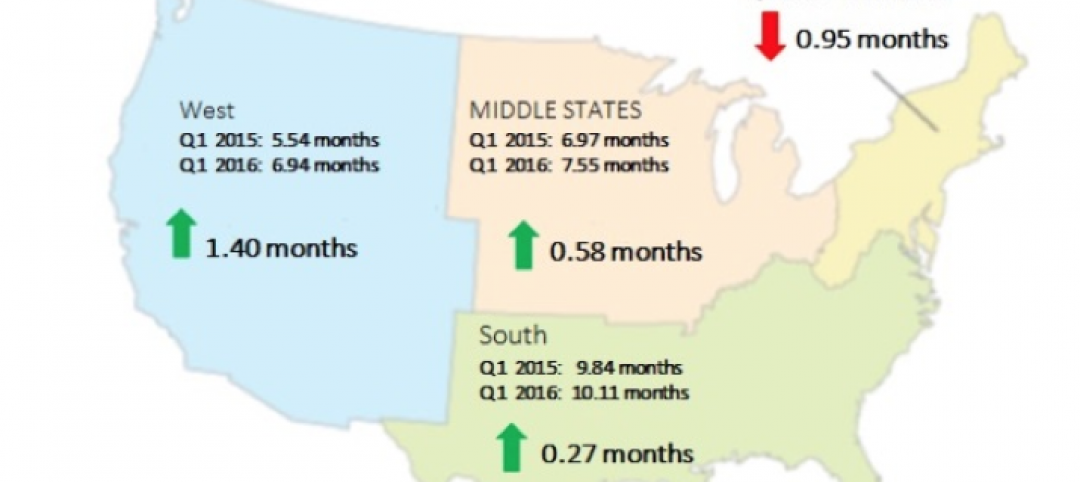
Multifamily Housing | Aug 12, 2016
Apartment completions in largest metros on pace to increase by 50% in 2016
Texas is leading this multifamily construction boom, according to latest RENTCafé estimates.
Market Data | Jul 29, 2016
ABC: Output expands, but nonresidential fixed investment falters
Nonresidential fixed investment fell for a third consecutive quarter, as indicated by Bureau of Economic Analysis data.
Industry Research | Jul 26, 2016
AIA consensus forecast sees construction spending on rise through next year
But several factors could make the industry downshift.
Architects | Jul 20, 2016
AIA: Architecture Billings Index remains on solid footing
The June ABI score was down from May, but the figure was positive for the fifth consecutive month.

Market Data | Jul 7, 2016
Airbnb alleged to worsen housing crunch in New York City
Allegedly removing thousands of housing units from market, driving up rents.

Market Data | Jul 6, 2016
Construction spending falls 0.8% from April to May
The private and public sectors have a combined estimated seasonally adjusted annual rate of $1.14 trillion.
Market Data | Jul 6, 2016
A thriving economy and influx of businesses spur construction in downtown Seattle
Development investment is twice what it was five years ago.

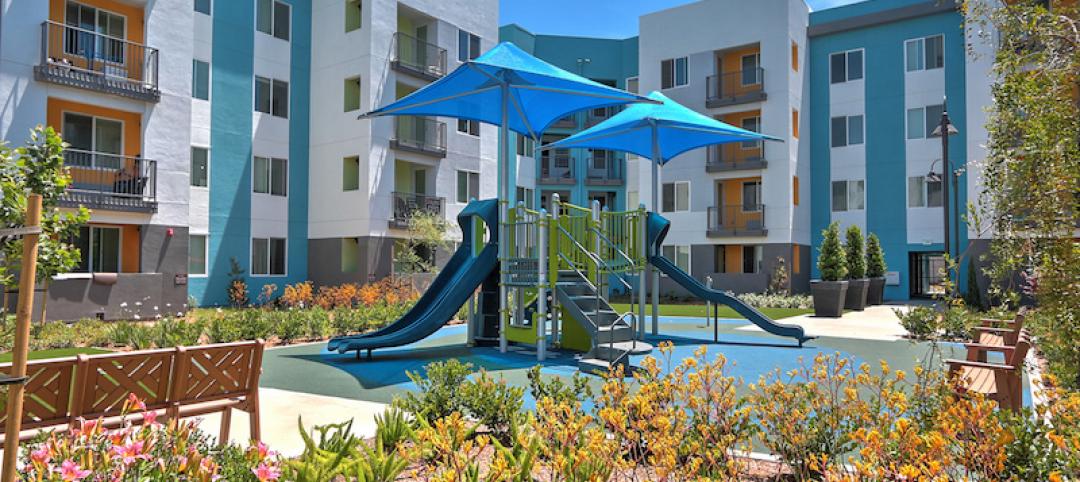
Multifamily Housing | Jul 5, 2016
Apartments continue to shrink, rents continue to rise
Latest survey by RENTCafé tracks size changes in 95 metros.
Multifamily Housing | Jun 22, 2016
Can multifamily construction keep up with projected demand?
The Joint Center for Housing Studies’ latest disection of America’s housing market finds moderate- and low-priced rentals in short supply.
Contractors | Jun 21, 2016
Bigness counts when it comes to construction backlogs
Large companies that can attract talent are better able to commit to more work, according to a national trade group for builders and contractors.


