


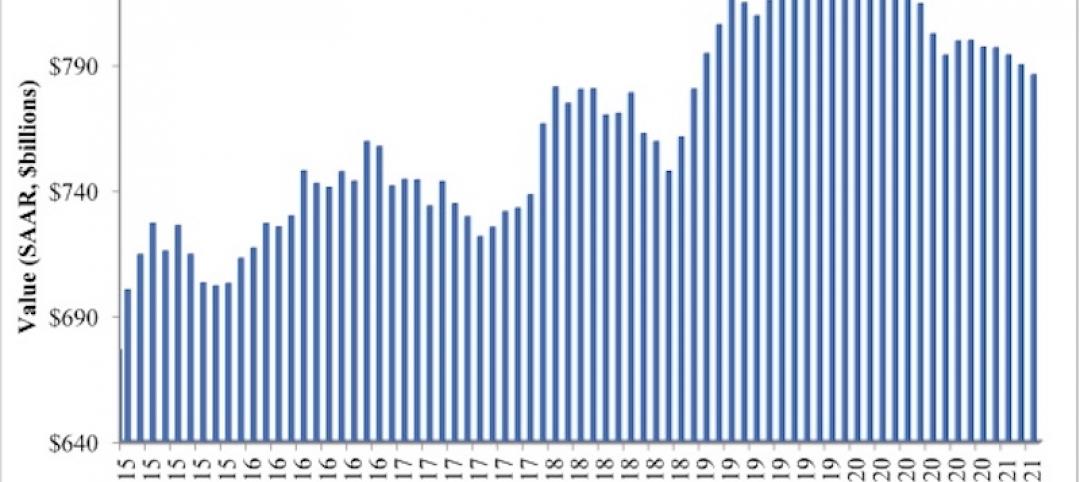
With all geographic regions and building project sectors showing positive conditions, there continues to be a heightened level of demand for design services signaled in the latest Architecture Billings Index (ABI). As a leading economic indicator of construction activity, the ABI reflects the approximate nine to twelve month lead time between architecture billings and construction spending. The American Institute of Architects (AIA) reported the August ABI score was 53.7, up from a score of 51.9 in the previous month. This score reflects an increase in design services provided by U.S. architecture firms (any score above 50 indicates an increase in billings). The new projects inquiry index was 62.5, up from a reading of 59.5 the previous month, while the new design contracts index eased somewhat from 56.4 to 54.2.
“The August results continue a string of very positive readings from the design professions, pointing to future healthy growth across the major construction sectors, as well as across the major regions of the country,” said AIA Chief Economist, Kermit Baker, Hon. AIA, PhD. “Given the focus and discussions around the infrastructure needs of the nation, we expect strong growth in design activity for the coming months and years.”
View this press release online here: https://www.aia.org/pres
Key August ABI highlights:
• Regional averages: South (55.7), Northeast (54.3), Midwest (52.5), West (51.3)
• Sector index breakdown: commercial / industrial (57.6), multi-family residential (53.8), mixed practice (52.5), institutional (50.1)
• Project inquiries index: 62.5
• Design contracts index: 54.2
The regional and sector categories are calculated as a 3-month moving average, whereas the national index, design contracts and inquiries are monthly numbers.
Related Stories
Market Data | Jun 16, 2021
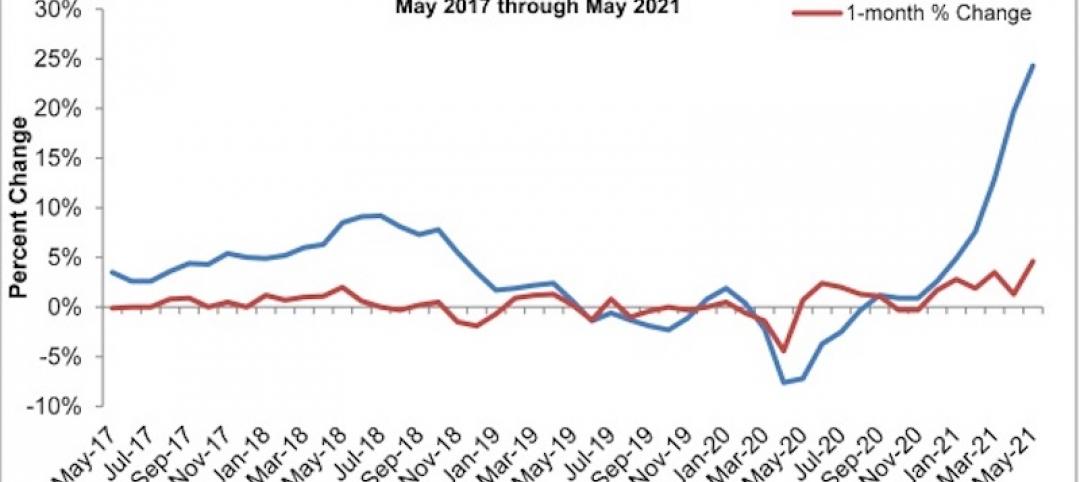
Construction input prices rise 4.6% in May; softwood lumber prices up 154% from a year ago
Construction input prices are 24.3% higher than a year ago, while nonresidential construction input prices increased 23.9% over that span.

Market Data | Jun 16, 2021
Producer prices for construction materials and services jump 24% over 12 months
The 24.3% increase in prices for materials used in construction from May 2020 to last month was nearly twice as great as in any previous year
Market Data | Jun 15, 2021
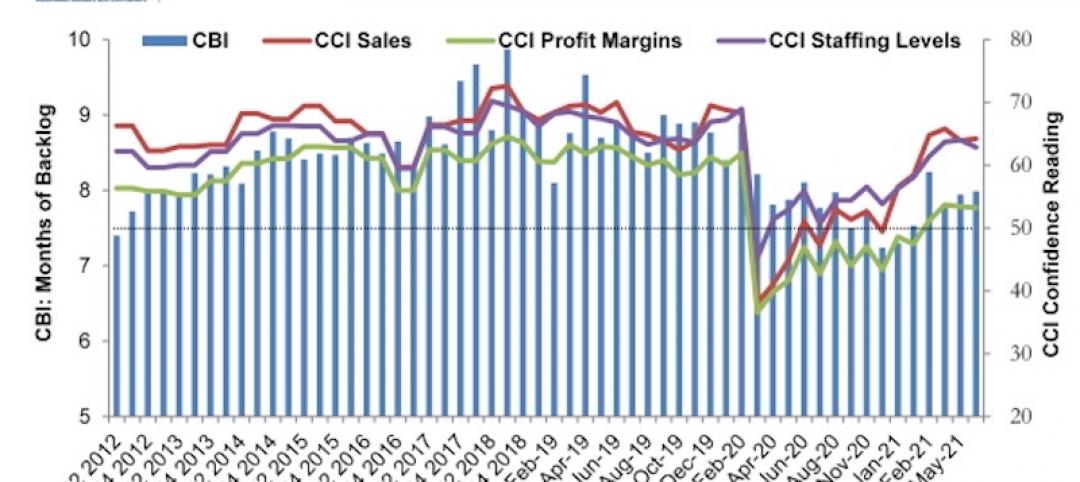
ABC’s Construction Backlog inches higher in May
Materials and labor shortages suppress contractor confidence.

Market Data | Jun 11, 2021
The countries with the most green buildings
As the country that set up the LEED initiative, the US is a natural leader in constructing green buildings.
Market Data | Jun 7, 2021
Construction employment slips by 20,000 in May
Seasonally adjusted construction employment in May totaled 7,423,000.
Market Data | Jun 2, 2021
Construction employment in April lags pre-covid February 2020 level in 107 metro areas
Houston-The Woodlands-Sugar Land and Odessa, Texas have worst 14-month construction job losses.
Market Data | Jun 1, 2021
Nonresidential construction spending decreases 0.5% in April
Spending was down on a monthly basis in nine of 16 nonresidential subcategories.
Market Data | Jun 1, 2021
Nonresidential construction outlays drop in April to two-year low
Public and private work declines amid supply-chain woes, soaring costs.
Market Data | May 24, 2021
Construction employment in April remains below pre-pandemic peak in 36 states and D.C.
Texas and Louisiana have worst job losses since February 2020, while Utah and Idaho are the top gainers.

Market Data | May 19, 2021
Design activity strongly increases
Demand signals construction is recovering.


