


With all geographic regions and building project sectors showing positive conditions, there continues to be a heightened level of demand for design services signaled in the latest Architecture Billings Index (ABI). As a leading economic indicator of construction activity, the ABI reflects the approximate nine to twelve month lead time between architecture billings and construction spending. The American Institute of Architects (AIA) reported the August ABI score was 53.7, up from a score of 51.9 in the previous month. This score reflects an increase in design services provided by U.S. architecture firms (any score above 50 indicates an increase in billings). The new projects inquiry index was 62.5, up from a reading of 59.5 the previous month, while the new design contracts index eased somewhat from 56.4 to 54.2.
“The August results continue a string of very positive readings from the design professions, pointing to future healthy growth across the major construction sectors, as well as across the major regions of the country,” said AIA Chief Economist, Kermit Baker, Hon. AIA, PhD. “Given the focus and discussions around the infrastructure needs of the nation, we expect strong growth in design activity for the coming months and years.”
View this press release online here: https://www.aia.org/pres
Key August ABI highlights:
• Regional averages: South (55.7), Northeast (54.3), Midwest (52.5), West (51.3)
• Sector index breakdown: commercial / industrial (57.6), multi-family residential (53.8), mixed practice (52.5), institutional (50.1)
• Project inquiries index: 62.5
• Design contracts index: 54.2
The regional and sector categories are calculated as a 3-month moving average, whereas the national index, design contracts and inquiries are monthly numbers.
Related Stories

Market Data | Aug 12, 2021
Steep rise in producer prices for construction materials and services continues in July.
The producer price index for new nonresidential construction rose 4.4% over the past 12 months.

Market Data | Aug 6, 2021
Construction industry adds 11,000 jobs in July
Nonresidential sector trails overall recovery.

Market Data | Aug 2, 2021
Nonresidential construction spending falls again in June
The fall was driven by a big drop in funding for highway and street construction and other public work.
Market Data | Jul 29, 2021
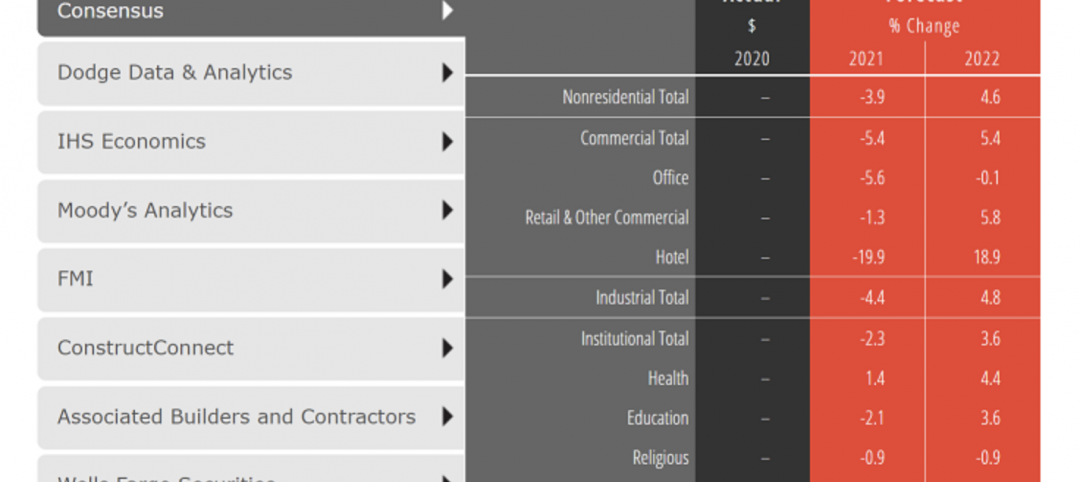
Outlook for construction spending improves with the upturn in the economy
The strongest design sector performers for the remainder of this year are expected to be health care facilities.
Market Data | Jul 29, 2021
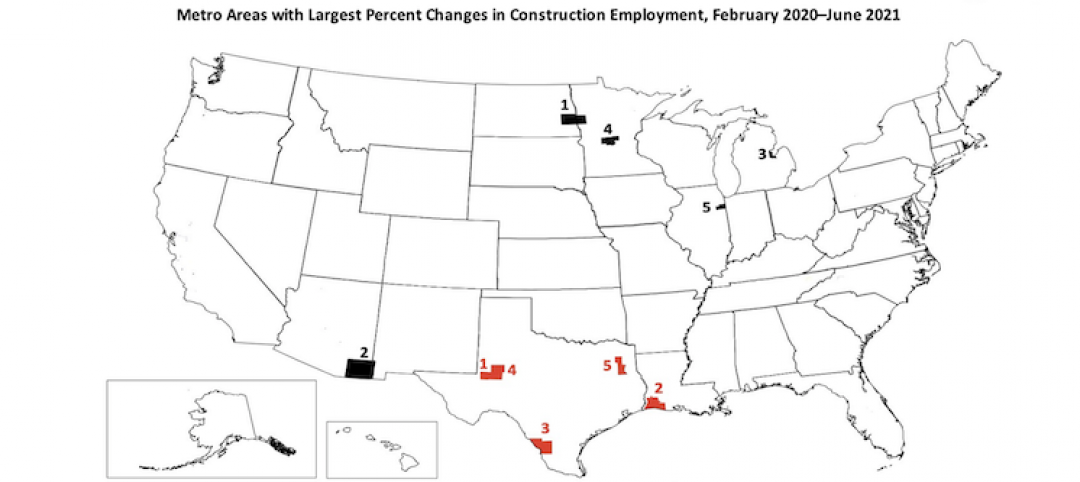
Construction employment lags or matches pre-pandemic level in 101 metro areas despite housing boom
Eighty metro areas had lower construction employment in June 2021 than February 2020.

Market Data | Jul 28, 2021
Marriott has the largest construction pipeline of U.S. franchise companies in Q2‘21
472 new hotels with 59,034 rooms opened across the United States during the first half of 2021.

Market Data | Jul 27, 2021
New York leads the U.S. hotel construction pipeline at the close of Q2‘21
Many hotel owners, developers, and management groups have used the operational downtime, caused by COVID-19’s impact on operating performance, as an opportunity to upgrade and renovate their hotels and/or redefine their hotels with a brand conversion.

Market Data | Jul 26, 2021
U.S. construction pipeline continues along the road to recovery
During the first and second quarters of 2021, the U.S. opened 472 new hotels with 59,034 rooms.

Market Data | Jul 21, 2021
Architecture Billings Index robust growth continues
AIA’s Architecture Billings Index (ABI) score for June remained at an elevated level of 57.1.

Market Data | Jul 20, 2021
Multifamily proposal activity maintains sizzling pace in Q2
Condos hit record high as all multifamily properties benefit from recovery.


