


With all geographic regions and building project sectors showing positive conditions, there continues to be a heightened level of demand for design services signaled in the latest Architecture Billings Index (ABI). As a leading economic indicator of construction activity, the ABI reflects the approximate nine to twelve month lead time between architecture billings and construction spending. The American Institute of Architects (AIA) reported the August ABI score was 53.7, up from a score of 51.9 in the previous month. This score reflects an increase in design services provided by U.S. architecture firms (any score above 50 indicates an increase in billings). The new projects inquiry index was 62.5, up from a reading of 59.5 the previous month, while the new design contracts index eased somewhat from 56.4 to 54.2.
“The August results continue a string of very positive readings from the design professions, pointing to future healthy growth across the major construction sectors, as well as across the major regions of the country,” said AIA Chief Economist, Kermit Baker, Hon. AIA, PhD. “Given the focus and discussions around the infrastructure needs of the nation, we expect strong growth in design activity for the coming months and years.”
View this press release online here: https://www.aia.org/pres
Key August ABI highlights:
• Regional averages: South (55.7), Northeast (54.3), Midwest (52.5), West (51.3)
• Sector index breakdown: commercial / industrial (57.6), multi-family residential (53.8), mixed practice (52.5), institutional (50.1)
• Project inquiries index: 62.5
• Design contracts index: 54.2
The regional and sector categories are calculated as a 3-month moving average, whereas the national index, design contracts and inquiries are monthly numbers.
Related Stories
Market Data | Sep 20, 2021
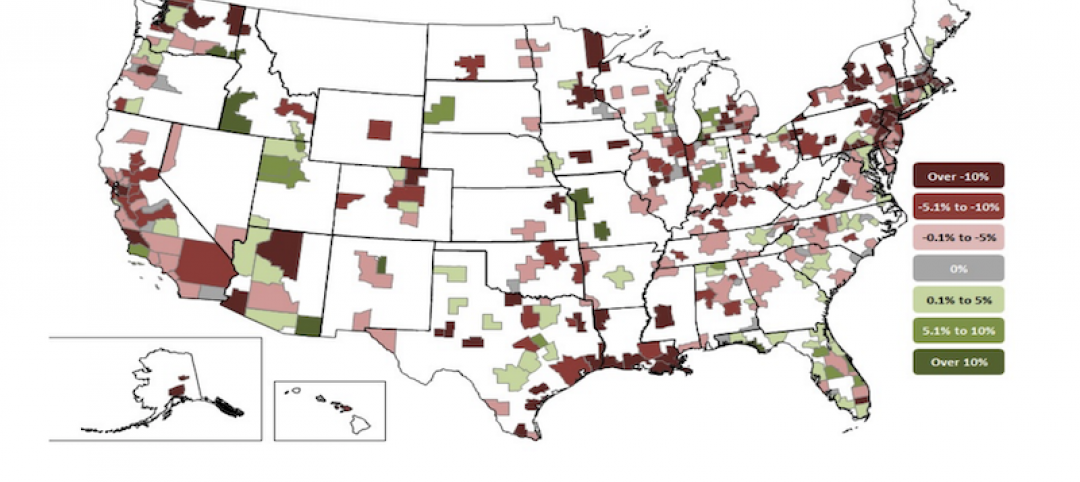
August construction employment lags pre-pandemic peak in 39 states
The coronavirus delta variant and supply problems hold back recovery.
Market Data | Sep 15, 2021
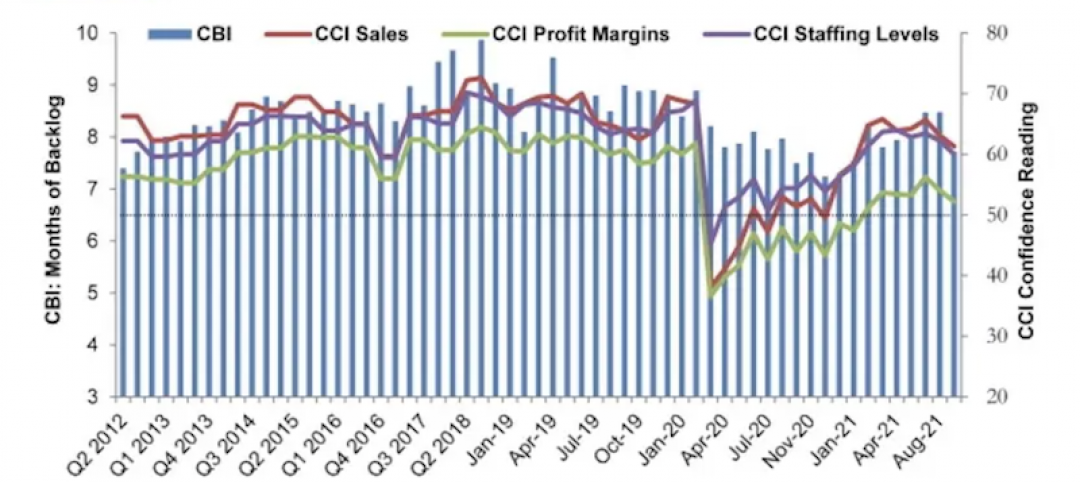
ABC’s Construction Backlog Indicator plummets in August; Contractor Confidence down
ABC’s Construction Confidence Index readings for sales, profit margins and staffing levels all fell modestly in August.
Market Data | Sep 7, 2021
Construction sheds 3,000 jobs in August
Gains are limited to homebuilding as other contractors struggle to fill both craft and salaried positions.

Market Data | Sep 3, 2021
Construction workforce shortages reach pre-pandemic levels
Coronavirus continues to impact projects and disrupt supply chains.

Multifamily Housing | Sep 1, 2021
Top 10 outdoor amenities at multifamily housing developments for 2021
Fire pits, lounge areas, and covered parking are the most common outdoor amenities at multifamily housing developments, according to new research from Multifamily Design+Construction.

Market Data | Sep 1, 2021
Construction spending posts small increase in July
Coronavirus, soaring costs, and supply disruptions threaten to erase further gains.
Market Data | Sep 1, 2021
Bradley Corp. survey finds office workers taking coronavirus precautions
Due to the rise in new strains of the virus, 70% of office workers have implemented a more rigorous handwashing regimen versus 59% of the general population.
Market Data | Aug 31, 2021
Three out of four metro areas add construction jobs from July 2020 to July 2021
COVID, rising costs, and supply chain woes may stall gains.
Market Data | Aug 24, 2021
July construction employment lags pre-pandemic peak in 36 states
Delta variant of coronavirus threatens to hold down further gains.

Market Data | Aug 17, 2021
Demand for design activity continues to expand
The ABI score for July was 54.6.


