


With all geographic regions and building project sectors showing positive conditions, there continues to be a heightened level of demand for design services signaled in the latest Architecture Billings Index (ABI). As a leading economic indicator of construction activity, the ABI reflects the approximate nine to twelve month lead time between architecture billings and construction spending. The American Institute of Architects (AIA) reported the August ABI score was 53.7, up from a score of 51.9 in the previous month. This score reflects an increase in design services provided by U.S. architecture firms (any score above 50 indicates an increase in billings). The new projects inquiry index was 62.5, up from a reading of 59.5 the previous month, while the new design contracts index eased somewhat from 56.4 to 54.2.
“The August results continue a string of very positive readings from the design professions, pointing to future healthy growth across the major construction sectors, as well as across the major regions of the country,” said AIA Chief Economist, Kermit Baker, Hon. AIA, PhD. “Given the focus and discussions around the infrastructure needs of the nation, we expect strong growth in design activity for the coming months and years.”
View this press release online here: https://www.aia.org/pres
Key August ABI highlights:
• Regional averages: South (55.7), Northeast (54.3), Midwest (52.5), West (51.3)
• Sector index breakdown: commercial / industrial (57.6), multi-family residential (53.8), mixed practice (52.5), institutional (50.1)
• Project inquiries index: 62.5
• Design contracts index: 54.2
The regional and sector categories are calculated as a 3-month moving average, whereas the national index, design contracts and inquiries are monthly numbers.
Related Stories

Healthcare Facilities | Feb 18, 2021
The Weekly show, Feb 18, 2021: What patients want from healthcare facilities, and Post-COVID retail trends
This week on The Weekly show, BD+C editors speak with AEC industry leaders from JLL and Landini Associates about what patients want from healthcare facilities, based on JLL's recent survey of 4,015 patients, and making online sales work for a retail sector recovery.
Market Data | Feb 17, 2021
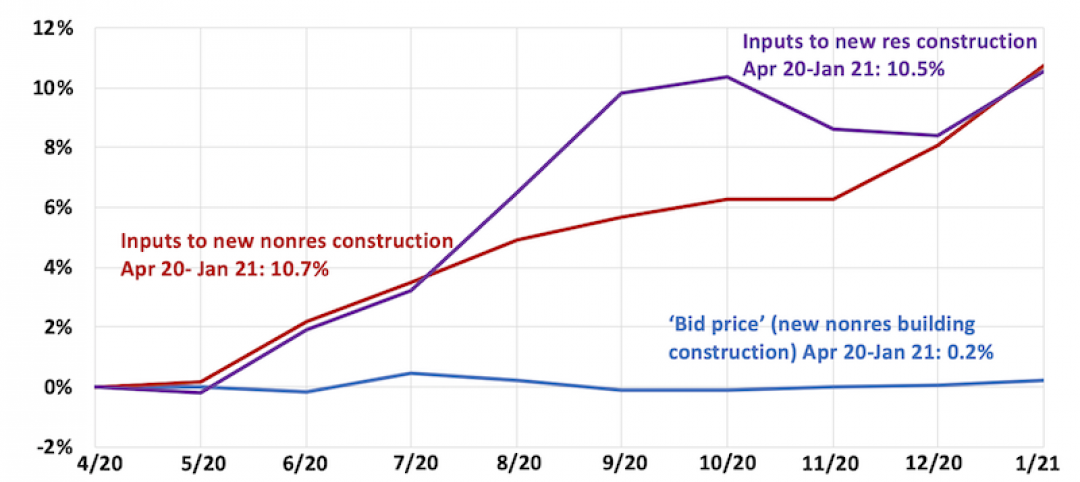
Soaring prices and delivery delays for lumber and steel squeeze finances for construction firms already hit by pandemic
Association officials call for removing tariffs on key materials to provide immediate relief for hard-hit contractors and exploring ways to expand long-term capacity for steel, lumber and other materials,

Market Data | Feb 9, 2021
Construction Backlog and contractor optimism rise to start 2021, according to ABC member survey
Despite the monthly uptick, backlog is 0.9 months lower than in January 2020.

Market Data | Feb 9, 2021
USGBC top 10 states for LEED in 2020
The Top 10 States for LEED green building is based on gross square feet of certified space per person using 2010 U.S. Census data and includes commercial and institutional projects certified in 2020.

Market Data | Feb 8, 2021
Construction employment stalls in January with unemployment rate of 9.4%
New measures threaten to undermine recovery.
Market Data | Feb 4, 2021
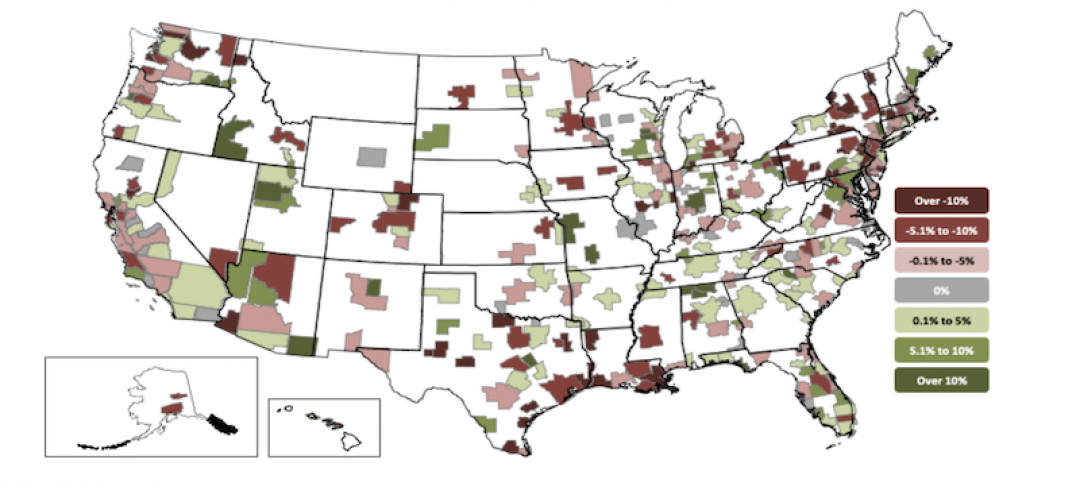
Construction employment declined in 2020 in majority of metro areas
Houston-The Woodlands-Sugar Land and Brockton-Bridgewater-Easton, Mass. have worst 2020 losses, while Indianapolis-Carmel-Anderson, Ind. and Walla Walla, Wash. register largest gains in industry jobs.

Market Data | Feb 3, 2021
Construction spending diverges in December with slump in private nonresidential sector, mixed public work, and boom in homebuilding
Demand for nonresidential construction and public works will decline amid ongoing pandemic concerns.

Market Data | Feb 1, 2021
The New York City market is back on top and leads the U.S. hotel construction pipeline
New York City has the greatest number of projects under construction with 108 projects/19,439 rooms.
Market Data | Jan 29, 2021
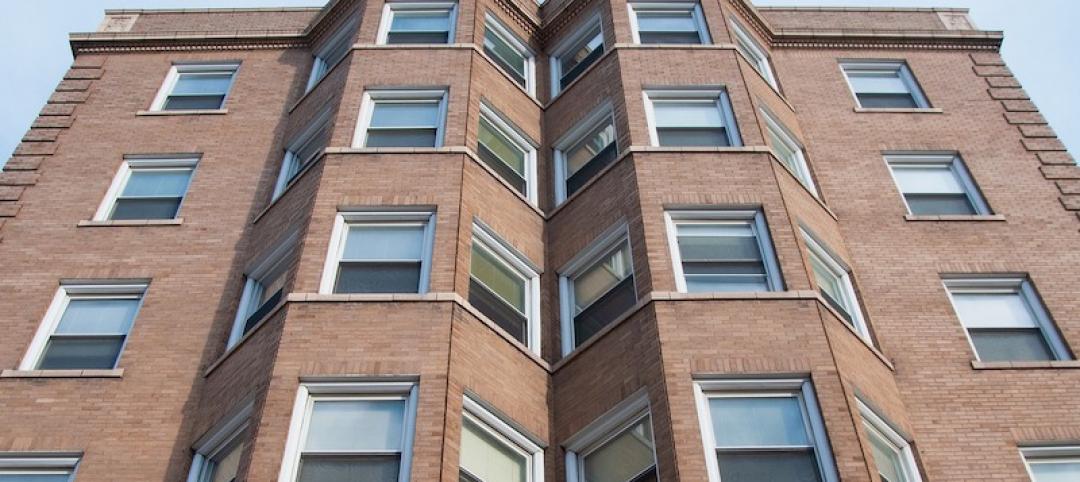
Multifamily housing construction outlook soars in late 2020
Exceeds pre-COVID levels, reaching highest mark since 1st quarter 2018.
Market Data | Jan 29, 2021
The U.S. hotel construction pipeline stands at 5,216 projects/650,222 rooms at year-end 2020
At the end of Q4 ‘20, projects currently under construction stand at 1,487 projects/199,700 rooms.


