

The U.S. office market continues to be one of the economy’s growth sectors, based on what the national real estate firm Transwestern gleans from the 48 of its markets that reported first-quarter results.
More than 45% of those markets—22, to be exact—registered improvements in direct vacancy, and 30 recorded increased in direct and sublet vacancy in the first quarter.
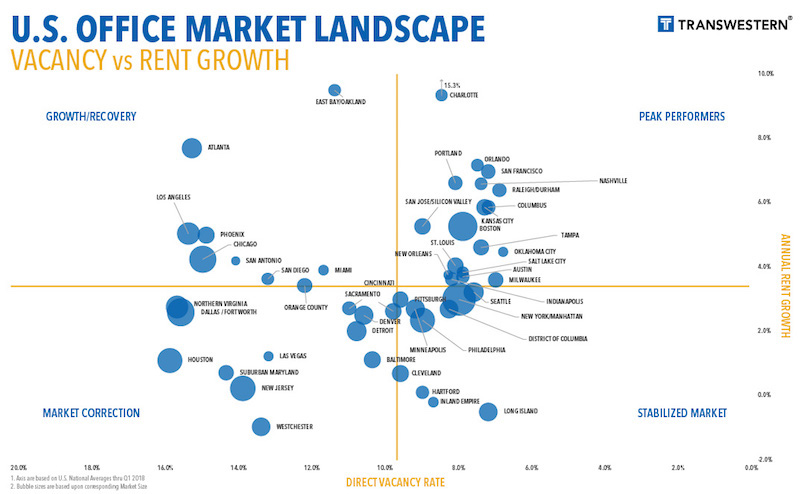
Overall, the office market’s vacancy rate, at 9.7% in the latest quarter, remained stable compared to the same period a year ago. And the vacancy rates were considerably lower in some of the country’s hottest real estate markets, such as Seattle (8.2%), Orlando (7.8%), Tampa (7.9%), and San Francisco (8.2%).
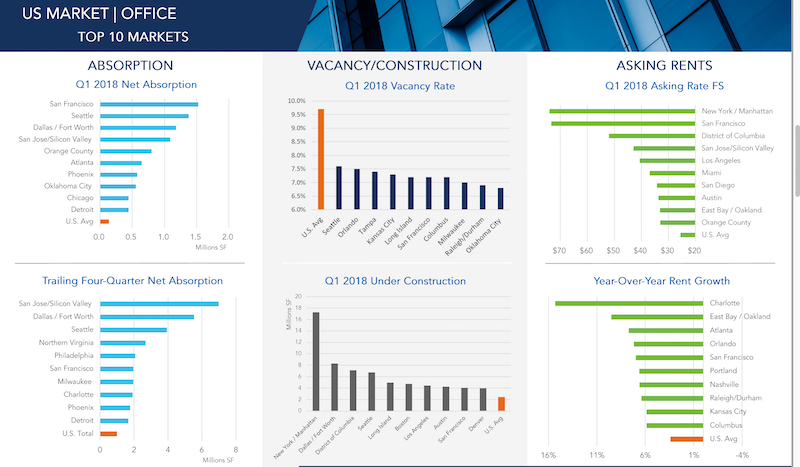
San Francisco was also the first-quarter leader in new absorptions, at more than 1.5 million sf, followed by Seattle, Dallas/Fort Worth, and San Jose, which was the leader in trailing four-quarters net absorption (nearly 7 million sf).
San Jose, Charlotte, Manhattan, and San Francisco were among the leading metros in terms of first-quarter office absorption and rent appreciation. Image: Transwestern U.S. Markets | Offices
All told, the U.S. market absorbed 14.1 million sf of office space in the first three months of 2018. That makes 31 consecutive quarters of positive absorption growth, although the absorption rate still lags three- and five-year quarterly averages.
Conversely, 1Q18 represented the fourth straight quarter of declines in new office construction, which stood at 141.1 million sf that period. Manhattan is by far and away the most active office construction market in the country, with nearly 18 million sf in starts in the first quarter. (Manhattan also has 432.9 million sf of office inventory, whose vacancy rate was 9.1%.) The next closest construction market, DFW, had 8.29 million sf in starts. (DFW’s vacancy rate was 16.7% in the first quarter.)
(The average new construction starts for Transwestern’s markets were 2 million sf.)
The number of office employees rose to 36 million, representing a 1.9% annual growth rate.
Transwestern states that the average asking rents continued to climb in the first quarter, marking the 20th consecutive month of increases. Charlotte, N.C., saw the biggest jump in asking rents, to 15.3%, followed by East Bay/Oakland, Calif. (9.5%) and Atlanta (7.7%).
Related Stories

Market Data | May 2, 2023
Nonresidential construction spending up 0.7% in March 2023 versus previous month
National nonresidential construction spending increased by 0.7% in March, according to an Associated Builders and Contractors analysis of data published today by the U.S. Census Bureau. On a seasonally adjusted annualized basis, nonresidential spending totaled $997.1 billion for the month.

Hotel Facilities | May 2, 2023
U.S. hotel construction up 9% in the first quarter of 2023, led by Marriott and Hilton
In the latest United States Construction Pipeline Trend Report from Lodging Econometrics (LE), analysts report that construction pipeline projects in the U.S. continue to increase, standing at 5,545 projects/658,207 rooms at the close of Q1 2023. Up 9% by both projects and rooms year-over-year (YOY); project totals at Q1 ‘23 are just 338 projects, or 5.7%, behind the all-time high of 5,883 projects recorded in Q2 2008.

Market Data | May 1, 2023
AEC firm proposal activity rebounds in the first quarter of 2023: PSMJ report
Proposal activity for architecture, engineering and construction (A/E/C) firms increased significantly in the 1st Quarter of 2023, according to PSMJ’s Quarterly Market Forecast (QMF) survey. The predictive measure of the industry’s health rebounded to a net plus/minus index (NPMI) of 32.8 in the first three months of the year.

Industry Research | Apr 25, 2023
The commercial real estate sector shouldn’t panic (yet) about recent bank failures
A new Cushman & Wakefield report depicts a “well capitalized” banking industry that is responding assertively to isolated weaknesses, but is also tightening its lending.

Architects | Apr 21, 2023
Architecture billings improve slightly in March
Architecture firms reported a modest increase in March billings. This positive news was tempered by a slight decrease in new design contracts according to a new report released today from The American Institute of Architects (AIA). March was the first time since last September in which billings improved.

Contractors | Apr 19, 2023
Rising labor, material prices cost subcontractors $97 billion in unplanned expenses
Subcontractors continue to bear the brunt of rising input costs for materials and labor, according to a survey of nearly 900 commercial construction professionals.

Data Centers | Apr 14, 2023
JLL's data center outlook: Cloud computing, AI driving exponential growth for data center industry
According to JLL’s new Global Data Center Outlook, the mass adoption of cloud computing and artificial intelligence (AI) is driving exponential growth for the data center industry, with hyperscale and edge computing leading investor demand.

Healthcare Facilities | Apr 13, 2023
Healthcare construction costs for 2023
Data from Gordian breaks down the average cost per square foot for a three-story hospital across 10 U.S. cities.

Higher Education | Apr 13, 2023
Higher education construction costs for 2023
Fresh data from Gordian breaks down the average cost per square foot for a two-story college classroom building across 10 U.S. cities.

Market Data | Apr 13, 2023
Construction input prices down year-over-year for first time since August 2020
Construction input prices increased 0.2% in March, according to an Associated Builders and Contractors analysis of U.S. Bureau of Labor Statistics Producer Price Index data released today. Nonresidential construction input prices rose 0.4% for the month.


