

The U.S. office market continues to be one of the economy’s growth sectors, based on what the national real estate firm Transwestern gleans from the 48 of its markets that reported first-quarter results.
More than 45% of those markets—22, to be exact—registered improvements in direct vacancy, and 30 recorded increased in direct and sublet vacancy in the first quarter.
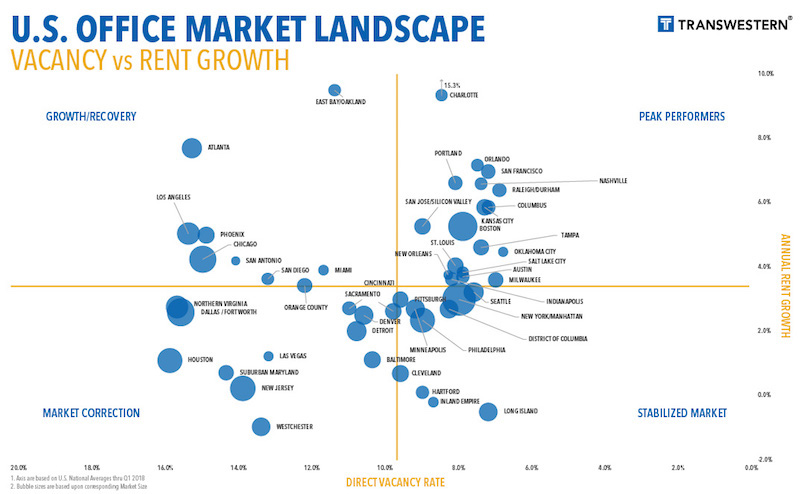
Overall, the office market’s vacancy rate, at 9.7% in the latest quarter, remained stable compared to the same period a year ago. And the vacancy rates were considerably lower in some of the country’s hottest real estate markets, such as Seattle (8.2%), Orlando (7.8%), Tampa (7.9%), and San Francisco (8.2%).
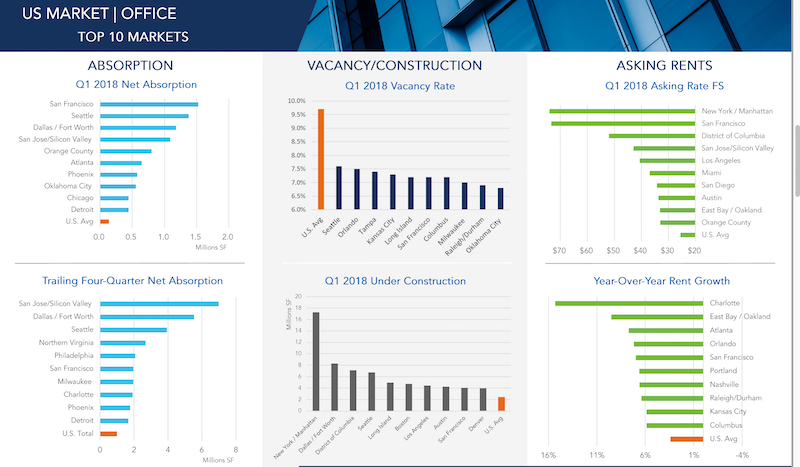
San Francisco was also the first-quarter leader in new absorptions, at more than 1.5 million sf, followed by Seattle, Dallas/Fort Worth, and San Jose, which was the leader in trailing four-quarters net absorption (nearly 7 million sf).
San Jose, Charlotte, Manhattan, and San Francisco were among the leading metros in terms of first-quarter office absorption and rent appreciation. Image: Transwestern U.S. Markets | Offices
All told, the U.S. market absorbed 14.1 million sf of office space in the first three months of 2018. That makes 31 consecutive quarters of positive absorption growth, although the absorption rate still lags three- and five-year quarterly averages.
Conversely, 1Q18 represented the fourth straight quarter of declines in new office construction, which stood at 141.1 million sf that period. Manhattan is by far and away the most active office construction market in the country, with nearly 18 million sf in starts in the first quarter. (Manhattan also has 432.9 million sf of office inventory, whose vacancy rate was 9.1%.) The next closest construction market, DFW, had 8.29 million sf in starts. (DFW’s vacancy rate was 16.7% in the first quarter.)
(The average new construction starts for Transwestern’s markets were 2 million sf.)
The number of office employees rose to 36 million, representing a 1.9% annual growth rate.
Transwestern states that the average asking rents continued to climb in the first quarter, marking the 20th consecutive month of increases. Charlotte, N.C., saw the biggest jump in asking rents, to 15.3%, followed by East Bay/Oakland, Calif. (9.5%) and Atlanta (7.7%).
Related Stories

Codes and Standards | Oct 26, 2022
‘Landmark study’ offers key recommendations for design-build delivery
The ACEC Research Institute and the University of Colorado Boulder released what the White House called a “landmark study” on the design-build delivery method.

Building Team | Oct 26, 2022
The U.S. hotel construction pipeline shows positive growth year-over-year at Q3 2022 close
According to the third quarter Construction Pipeline Trend Report for the United States from Lodging Econometrics (LE), the U.S. construction pipeline stands at 5,317 projects/629,489 rooms, up 10% by projects and 6% rooms Year-Over-Year (YOY).

Designers | Oct 19, 2022
Architecture Billings Index moderates but remains healthy
For the twentieth consecutive month architecture firms reported increasing demand for design services in September, according to a new report today from The American Institute of Architects (AIA).

Market Data | Oct 17, 2022
Calling all AEC professionals! BD+C editors need your expertise for our 2023 market forecast survey
The BD+C editorial team needs your help with an important research project. We are conducting research to understand the current state of the U.S. design and construction industry.

Market Data | Oct 14, 2022
ABC’s Construction Backlog Indicator Jumps in September; Contractor Confidence Remains Steady
Associated Builders and Contractors reports today that its Construction Backlog Indicator increased to 9.0 months in September, according to an ABC member survey conducted Sept. 20 to Oct. 5.

Market Data | Oct 12, 2022
ABC: Construction Input Prices Inched Down in September; Up 41% Since February 2020
Construction input prices dipped 0.1% in September compared to the previous month, according to an Associated Builders and Contractors analysis of U.S. Bureau of Labor Statistics’ Producer Price Index data released today.

Laboratories | Oct 5, 2022
Bigger is better for a maturing life sciences sector
CRB's latest report predicts more diversification and vertical integration in research and production.

Market Data | Aug 25, 2022
‘Disruptions’ will moderate construction spending through next year
JLL’s latest outlook predicts continued pricing volatility due to shortages in materials and labor

Market Data | Aug 2, 2022
Nonresidential construction spending falls 0.5% in June, says ABC
National nonresidential construction spending was down by 0.5% in June, according to an Associated Builders and Contractors analysis of data published today by the U.S. Census Bureau.

Market Data | Jul 28, 2022
The latest Beck Group report sees earlier project collaboration as one way out of the inflation/supply chain malaise
In the first six months of 2022, quarter-to-quarter inflation for construction materials showed signs of easing, but only slightly.


