

The U.S. office market continues to be one of the economy’s growth sectors, based on what the national real estate firm Transwestern gleans from the 48 of its markets that reported first-quarter results.
More than 45% of those markets—22, to be exact—registered improvements in direct vacancy, and 30 recorded increased in direct and sublet vacancy in the first quarter.
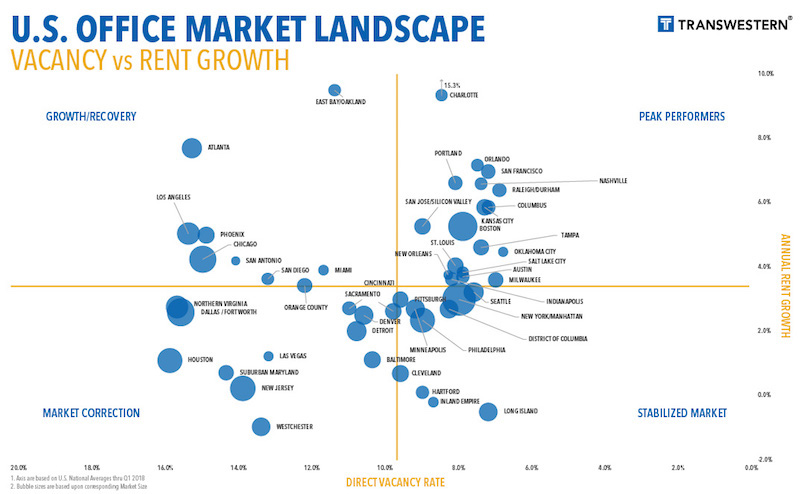
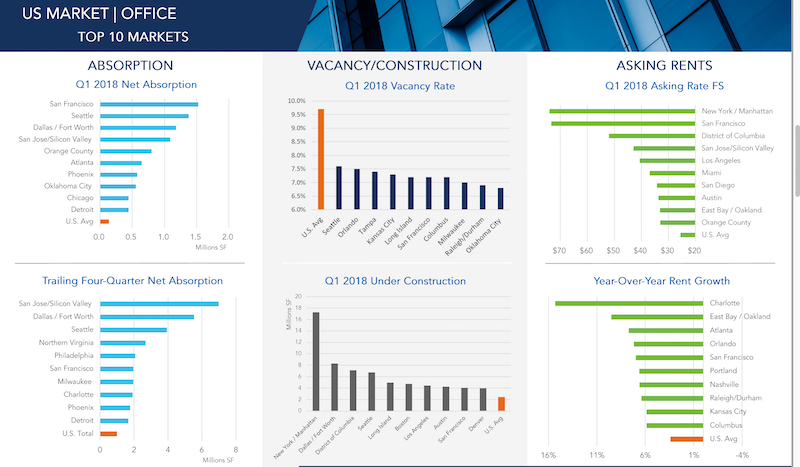
Overall, the office market’s vacancy rate, at 9.7% in the latest quarter, remained stable compared to the same period a year ago. And the vacancy rates were considerably lower in some of the country’s hottest real estate markets, such as Seattle (8.2%), Orlando (7.8%), Tampa (7.9%), and San Francisco (8.2%).
San Francisco was also the first-quarter leader in new absorptions, at more than 1.5 million sf, followed by Seattle, Dallas/Fort Worth, and San Jose, which was the leader in trailing four-quarters net absorption (nearly 7 million sf).
San Jose, Charlotte, Manhattan, and San Francisco were among the leading metros in terms of first-quarter office absorption and rent appreciation. Image: Transwestern U.S. Markets | Offices
All told, the U.S. market absorbed 14.1 million sf of office space in the first three months of 2018. That makes 31 consecutive quarters of positive absorption growth, although the absorption rate still lags three- and five-year quarterly averages.
Conversely, 1Q18 represented the fourth straight quarter of declines in new office construction, which stood at 141.1 million sf that period. Manhattan is by far and away the most active office construction market in the country, with nearly 18 million sf in starts in the first quarter. (Manhattan also has 432.9 million sf of office inventory, whose vacancy rate was 9.1%.) The next closest construction market, DFW, had 8.29 million sf in starts. (DFW’s vacancy rate was 16.7% in the first quarter.)
(The average new construction starts for Transwestern’s markets were 2 million sf.)
The number of office employees rose to 36 million, representing a 1.9% annual growth rate.
Transwestern states that the average asking rents continued to climb in the first quarter, marking the 20th consecutive month of increases. Charlotte, N.C., saw the biggest jump in asking rents, to 15.3%, followed by East Bay/Oakland, Calif. (9.5%) and Atlanta (7.7%).
Related Stories

Market Data | Jan 10, 2023
Construction backlogs at highest level since Q2 2019, says ABC
Associated Builders and Contractors reports today that its Construction Backlog Indicator remained unchanged at 9.2 months in December 2022, according to an ABC member survey conducted Dec. 20, 2022, to Jan. 5, 2023. The reading is one month higher than in December 2021.

Market Data | Jan 6, 2023
Nonresidential construction spending rises in November 2022
Spending on nonresidential construction work in the U.S. was up 0.9% in November versus the previous month, and 11.8% versus the previous year, according to the U.S. Census Bureau.

Industry Research | Dec 28, 2022
Following a strong year, design and construction firms view 2023 cautiously
The economy and inflation are the biggest concerns for U.S. architecture, construction, and engineering firms in 2023, according to a recent survey of AEC professionals by the editors of Building Design+Construction.

Self-Storage Facilities | Dec 16, 2022
Self-storage development booms in high multifamily construction areas
A 2022 RentCafe analysis finds that self-storage units swelled in conjunction with metros’ growth in apartment complexes.

Market Data | Dec 13, 2022
Contractors' backlog of work reaches three-year high
U.S. construction firms have, on average, 9.2 months of work in the pipeline, according to ABC's latest Construction Backlog Indicator.

Contractors | Dec 6, 2022
Slow payments cost the construction industry $208 billion in 2022
The cost of floating payments for wages and invoices represents $208 billion in excess cost to the construction industry, a 53% increase from 2021, according to a survey by Rabbet, a provider of construction finance software.

Mass Timber | Dec 1, 2022
Cross laminated timber market forecast to more than triple by end of decade
Cross laminated timber (CLT) is gaining acceptance as an eco-friendly building material, a trend that will propel its growth through the end of the 2020s. The CLT market is projected to more than triple from $1.11 billion in 2021 to $3.72 billion by 2030, according to a report from Polaris Market Research.
Market Data | Nov 15, 2022
Construction demand will be a double-edged sword in 2023
Skanska’s latest forecast sees shorter lead times and receding inflation, but the industry isn’t out of the woods yet.

Reconstruction & Renovation | Nov 8, 2022
Renovation work outpaces new construction for first time in two decades
Renovations of older buildings in U.S. cities recently hit a record high as reflected in architecture firm billings, according to the American Institute of Architects (AIA).

Market Data | Nov 3, 2022
Building material prices have become the calm in America’s economic storm
Linesight’s latest quarterly report predicts stability (mostly) through the first half of 2023


