

The U.S. office market continues to be one of the economy’s growth sectors, based on what the national real estate firm Transwestern gleans from the 48 of its markets that reported first-quarter results.
More than 45% of those markets—22, to be exact—registered improvements in direct vacancy, and 30 recorded increased in direct and sublet vacancy in the first quarter.
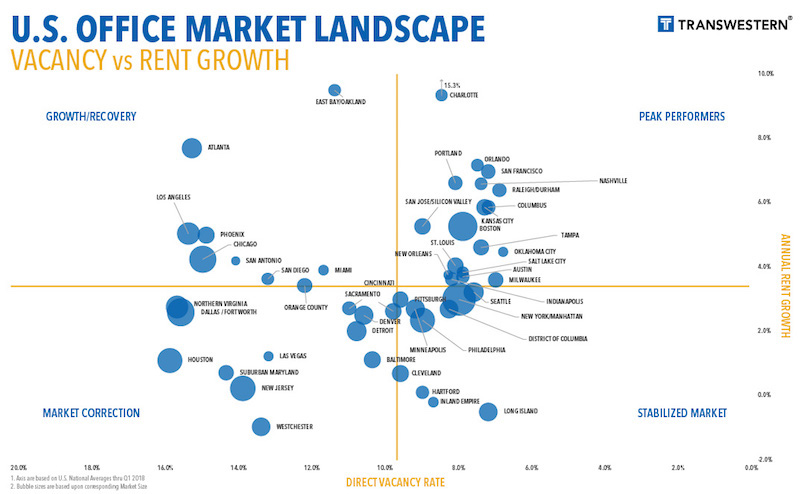
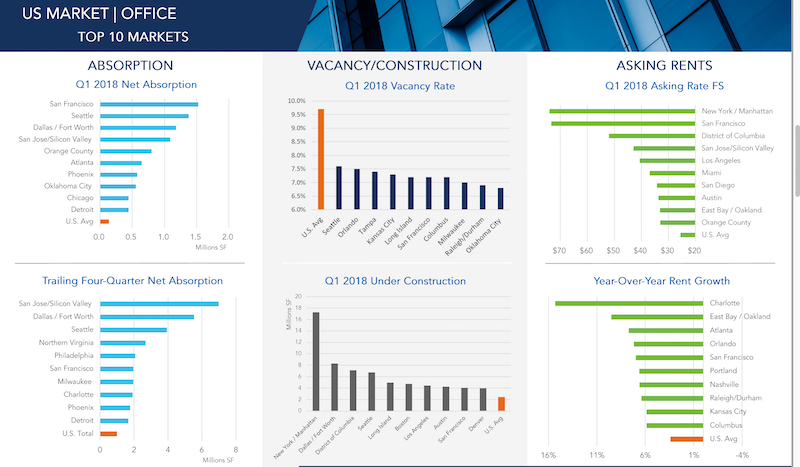
Overall, the office market’s vacancy rate, at 9.7% in the latest quarter, remained stable compared to the same period a year ago. And the vacancy rates were considerably lower in some of the country’s hottest real estate markets, such as Seattle (8.2%), Orlando (7.8%), Tampa (7.9%), and San Francisco (8.2%).
San Francisco was also the first-quarter leader in new absorptions, at more than 1.5 million sf, followed by Seattle, Dallas/Fort Worth, and San Jose, which was the leader in trailing four-quarters net absorption (nearly 7 million sf).
San Jose, Charlotte, Manhattan, and San Francisco were among the leading metros in terms of first-quarter office absorption and rent appreciation. Image: Transwestern U.S. Markets | Offices
All told, the U.S. market absorbed 14.1 million sf of office space in the first three months of 2018. That makes 31 consecutive quarters of positive absorption growth, although the absorption rate still lags three- and five-year quarterly averages.
Conversely, 1Q18 represented the fourth straight quarter of declines in new office construction, which stood at 141.1 million sf that period. Manhattan is by far and away the most active office construction market in the country, with nearly 18 million sf in starts in the first quarter. (Manhattan also has 432.9 million sf of office inventory, whose vacancy rate was 9.1%.) The next closest construction market, DFW, had 8.29 million sf in starts. (DFW’s vacancy rate was 16.7% in the first quarter.)
(The average new construction starts for Transwestern’s markets were 2 million sf.)
The number of office employees rose to 36 million, representing a 1.9% annual growth rate.
Transwestern states that the average asking rents continued to climb in the first quarter, marking the 20th consecutive month of increases. Charlotte, N.C., saw the biggest jump in asking rents, to 15.3%, followed by East Bay/Oakland, Calif. (9.5%) and Atlanta (7.7%).
Related Stories

Contractors | May 1, 2024
Nonresidential construction spending rises 0.2% in March 2024 to $1.19 trillion
National nonresidential construction spending increased 0.2% in March, according to an Associated Builders and Contractors analysis of data published today by the U.S. Census Bureau. On a seasonally adjusted annualized basis, nonresidential spending totaled $1.19 trillion.

AEC Tech | Apr 30, 2024
Lack of organizational readiness is biggest hurdle to artificial intelligence adoption
Managers of companies in the industrial sector, including construction, have bought the hype of artificial intelligence (AI) as a transformative technology, but their organizations are not ready to realize its promise, according to research from IFS, a global cloud enterprise software company. An IFS survey of 1,700 senior decision-makers found that 84% of executives anticipate massive organizational benefits from AI.

Hotel Facilities | Apr 24, 2024
The U.S. hotel construction market sees record highs in the first quarter of 2024
As seen in the Q1 2024 U.S. Hotel Construction Pipeline Trend Report from Lodging Econometrics (LE), at the end of the first quarter, there are 6,065 projects with 702,990 rooms in the pipeline. This new all-time high represents a 9% year-over-year (YOY) increase in projects and a 7% YOY increase in rooms compared to last year.

Construction Costs | Apr 18, 2024
New download: BD+C's April 2024 Market Intelligence Report
Building Design+Construction's monthly Market Intelligence Report offers a snapshot of the health of the U.S. building construction industry, including the commercial, multifamily, institutional, and industrial building sectors. This report tracks the latest metrics related to construction spending, demand for design services, contractor backlogs, and material price trends.

Market Data | Apr 16, 2024
The average U.S. contractor has 8.2 months worth of construction work in the pipeline, as of March 2024
Associated Builders and Contractors reported today that its Construction Backlog Indicator increased to 8.2 months in March from 8.1 months in February, according to an ABC member survey conducted March 20 to April 3. The reading is down 0.5 months from March 2023.

K-12 Schools | Apr 10, 2024
Surprise, surprise: Students excel in modernized K-12 school buildings
Too many of the nation’s school districts are having to make it work with less-than-ideal educational facilities. But at what cost to student performance and staff satisfaction?

Multifamily Housing | Apr 9, 2024
March reports record gains in multifamily rent growth in 20 months
Asking rents for multifamily units increased $8 during the month to $1,721; year-over-year growth grew 30 basis points to 0.9 percent—a normal seasonal growth pattern according to Yardi Matrix.

Retail Centers | Apr 4, 2024
Retail design trends: Consumers are looking for wellness in where they shop
Consumers are making lifestyle choices with wellness in mind, which ignites in them a feeling of purpose and a sense of motivation. That’s the conclusion that the architecture and design firm MG2 draws from a survey of 1,182 U.S. adult consumers the firm conducted last December about retail design and what consumers want in healthier shopping experiences.

Market Data | Apr 1, 2024
Nonresidential construction spending dips 1.0% in February, reaches $1.179 trillion
National nonresidential construction spending declined 1.0% in February, according to an Associated Builders and Contractors analysis of data published today by the U.S. Census Bureau. On a seasonally adjusted annualized basis, nonresidential spending totaled $1.179 trillion.

Market Data | Mar 26, 2024
Architecture firm billings see modest easing in February
Architecture firm billings continued to decline in February, with an AIA/Deltek Architecture Billings Index (ABI) score of 49.5 for the month. However, February’s score marks the most modest easing in billings since July 2023 and suggests that the recent slowdown may be receding.


