

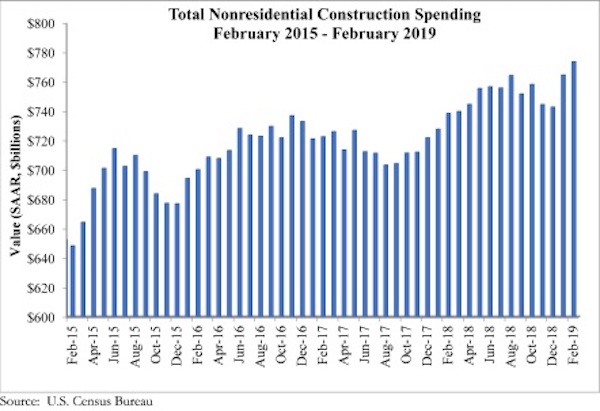
According to an Associated Builders and Contractors analysis of U.S. Census Bureau data released today, national nonresidential construction spending rose 1.2% in February. Seasonally adjusted nonresidential spending totaled $773.8 billion, a 4.8% increase over the same time last year.
Private nonresidential spending fell 0.5% for the month and is only up 0.1% on a year-over-year basis. Public nonresidential spending is up 3.7% for the month and an impressive 12.1% for the year. Highway and street (+9.6%), water supply (+5.2%) and sewage and waste disposal (+5%) spending experienced the largest monthly increases in February, while religious (-4%) and transportation (-3.8%) spending experienced the largest decreases.
“A number of economic readings have come in weaker than expected of late, including retail sales and February employment,” said ABC Chief Economist Anirban Basu. “Now private nonresidential construction has effectively flatlined during the past year, with spending virtually unchanged on a year-ago basis despite higher materials costs. This suggests that the actual physical amount of construction put in place has declined in real terms during the past year.
“As is often the case, it’s tempting to blame the weather,” said Basu. “It is absolutely true that the upper Midwest and New England were hit hard by precipitation and bitterly cold temperatures this winter, which undoubtedly suppressed some level of activity. However, softer growth in private nonresidential construction has been apparent for months. This is not a new phenomenon. Spending in the office, commercial and lodging categories was flat to declining in February.
“By contrast, public nonresidential construction spending was up sharply,” said Basu. “This strongly suggests that there is more at work than weather in terms of factors shaping the data. State and local government finances have continued to improve as the broader economy has expanded. America has generated job growth for 101 consecutive months, which has helped push income tax collections higher and unemployment insurance payments lower. Property values also have risen, as have sales tax collections.
“The standout is the highway and street category, which has experienced nearly 23% growth in spending on a year-over-year basis,” Basu added. “Policymakers also have been paying considerable attention to flood control (with conservation and development up 19% year over year) and water systems (with water supply up nearly 12%).”


Related Stories

Hotel Facilities | Jul 27, 2023
U.S. hotel construction pipeline remains steady with 5,572 projects in the works
The hotel construction pipeline grew incrementally in Q2 2023 as developers and franchise companies push through short-term challenges while envisioning long-term prospects, according to Lodging Econometrics.

Hotel Facilities | Jul 26, 2023
Hospitality building construction costs for 2023
Data from Gordian breaks down the average cost per square foot for 15-story hotels, restaurants, fast food restaurants, and movie theaters across 10 U.S. cities: Boston, Chicago, Las Vegas, Los Angeles, Miami, New Orleans, New York, Phoenix, Seattle, and Washington, D.C.

Market Data | Jul 24, 2023
Leading economists call for 2% increase in building construction spending in 2024
Following a 19.7% surge in spending for commercial, institutional, and industrial buildings in 2023, leading construction industry economists expect spending growth to come back to earth in 2024, according to the July 2023 AIA Consensus Construction Forecast Panel.

Contractors | Jul 13, 2023
Construction input prices remain unchanged in June, inflation slowing
Construction input prices remained unchanged in June compared to the previous month, according to an Associated Builders and Contractors analysis of U.S. Bureau of Labor Statistics Producer Price Index data released today. Nonresidential construction input prices were also unchanged for the month.

Contractors | Jul 11, 2023
The average U.S. contractor has 8.9 months worth of construction work in the pipeline, as of June 2023
Associated Builders and Contractors reported that its Construction Backlog Indicator remained unchanged at 8.9 months in June 2023, according to an ABC member survey conducted June 20 to July 5. The reading is unchanged from June 2022.

Market Data | Jul 5, 2023
Nonresidential construction spending decreased in May, its first drop in nearly a year
National nonresidential construction spending decreased 0.2% in May, according to an Associated Builders and Contractors analysis of data published today by the U.S. Census Bureau. On a seasonally adjusted annualized basis, nonresidential spending totaled $1.06 trillion.

Apartments | Jun 27, 2023
Average U.S. apartment rent reached all-time high in May, at $1,716
Multifamily rents continued to increase through the first half of 2023, despite challenges for the sector and continuing economic uncertainty. But job growth has remained robust and new households keep forming, creating apartment demand and ongoing rent growth. The average U.S. apartment rent reached an all-time high of $1,716 in May.

Industry Research | Jun 15, 2023
Exurbs and emerging suburbs having fastest population growth, says Cushman & Wakefield
Recently released county and metro-level population growth data by the U.S. Census Bureau shows that the fastest growing areas are found in exurbs and emerging suburbs.

Contractors | Jun 13, 2023
The average U.S. contractor has 8.9 months worth of construction work in the pipeline, as of May 2023
Associated Builders and Contractors reported that its Construction Backlog Indicator remained unchanged at 8.9 months in May, according to an ABC member survey conducted May 20 to June 7. The reading is 0.1 months lower than in May 2022. Backlog in the infrastructure category ticked up again and has now returned to May 2022 levels. On a regional basis, backlog increased in every region but the Northeast.

Industry Research | Jun 13, 2023
Two new surveys track how the construction industry, in the U.S. and globally, is navigating market disruption and volatility
The surveys, conducted by XYZ Reality and KPMG International, found greater willingness to embrace technology, workplace diversity, and ESG precepts.


