

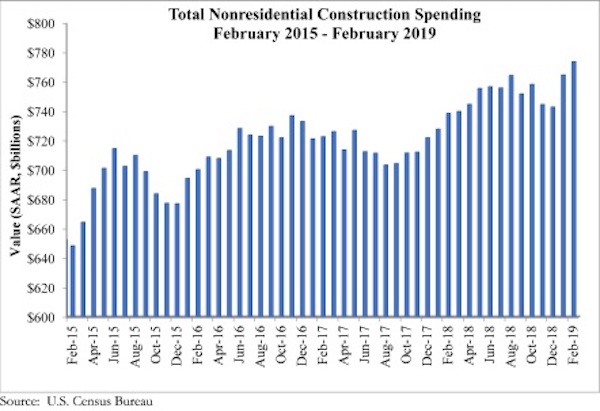
According to an Associated Builders and Contractors analysis of U.S. Census Bureau data released today, national nonresidential construction spending rose 1.2% in February. Seasonally adjusted nonresidential spending totaled $773.8 billion, a 4.8% increase over the same time last year.
Private nonresidential spending fell 0.5% for the month and is only up 0.1% on a year-over-year basis. Public nonresidential spending is up 3.7% for the month and an impressive 12.1% for the year. Highway and street (+9.6%), water supply (+5.2%) and sewage and waste disposal (+5%) spending experienced the largest monthly increases in February, while religious (-4%) and transportation (-3.8%) spending experienced the largest decreases.
“A number of economic readings have come in weaker than expected of late, including retail sales and February employment,” said ABC Chief Economist Anirban Basu. “Now private nonresidential construction has effectively flatlined during the past year, with spending virtually unchanged on a year-ago basis despite higher materials costs. This suggests that the actual physical amount of construction put in place has declined in real terms during the past year.
“As is often the case, it’s tempting to blame the weather,” said Basu. “It is absolutely true that the upper Midwest and New England were hit hard by precipitation and bitterly cold temperatures this winter, which undoubtedly suppressed some level of activity. However, softer growth in private nonresidential construction has been apparent for months. This is not a new phenomenon. Spending in the office, commercial and lodging categories was flat to declining in February.
“By contrast, public nonresidential construction spending was up sharply,” said Basu. “This strongly suggests that there is more at work than weather in terms of factors shaping the data. State and local government finances have continued to improve as the broader economy has expanded. America has generated job growth for 101 consecutive months, which has helped push income tax collections higher and unemployment insurance payments lower. Property values also have risen, as have sales tax collections.
“The standout is the highway and street category, which has experienced nearly 23% growth in spending on a year-over-year basis,” Basu added. “Policymakers also have been paying considerable attention to flood control (with conservation and development up 19% year over year) and water systems (with water supply up nearly 12%).”


Related Stories

Contractors | Apr 19, 2023
Rising labor, material prices cost subcontractors $97 billion in unplanned expenses
Subcontractors continue to bear the brunt of rising input costs for materials and labor, according to a survey of nearly 900 commercial construction professionals.

Data Centers | Apr 14, 2023
JLL's data center outlook: Cloud computing, AI driving exponential growth for data center industry
According to JLL’s new Global Data Center Outlook, the mass adoption of cloud computing and artificial intelligence (AI) is driving exponential growth for the data center industry, with hyperscale and edge computing leading investor demand.

Healthcare Facilities | Apr 13, 2023
Healthcare construction costs for 2023
Data from Gordian breaks down the average cost per square foot for a three-story hospital across 10 U.S. cities.

Higher Education | Apr 13, 2023
Higher education construction costs for 2023
Fresh data from Gordian breaks down the average cost per square foot for a two-story college classroom building across 10 U.S. cities.

Market Data | Apr 13, 2023
Construction input prices down year-over-year for first time since August 2020
Construction input prices increased 0.2% in March, according to an Associated Builders and Contractors analysis of U.S. Bureau of Labor Statistics Producer Price Index data released today. Nonresidential construction input prices rose 0.4% for the month.

Market Data | Apr 11, 2023
Construction crane count reaches all-time high in Q1 2023
Toronto, Seattle, Los Angeles, and Denver top the list of U.S/Canadian cities with the greatest number of fixed cranes on construction sites, according to Rider Levett Bucknall's RLB Crane Index for North America for Q1 2023.

Contractors | Apr 11, 2023
The average U.S. contractor has 8.7 months worth of construction work in the pipeline, as of March 2023
Associated Builders and Contractors reported that its Construction Backlog Indicator declined to 8.7 months in March, according to an ABC member survey conducted March 20 to April 3. The reading is 0.4 months higher than in March 2022.

Market Data | Apr 6, 2023
JLL’s 2023 Construction Outlook foresees growth tempered by cost increases
The easing of supply chain snags for some product categories, and the dispensing with global COVID measures, have returned the North American construction sector to a sense of normal. However, that return is proving to be complicated, with the construction industry remaining exceptionally busy at a time when labor and materials cost inflation continues to put pricing pressure on projects, leading to caution in anticipation of a possible downturn. That’s the prognosis of JLL’s just-released 2023 U.S. and Canada Construction Outlook.

Market Data | Apr 4, 2023
Nonresidential construction spending up 0.4% in February 2023
National nonresidential construction spending increased 0.4% in February, according to an Associated Builders and Contractors analysis of data published by the U.S. Census Bureau. On a seasonally adjusted annualized basis, nonresidential spending totaled $982.2 billion for the month, up 16.8% from the previous year.

Multifamily Housing | Mar 24, 2023
Average size of new apartments dropped sharply in 2022
The average size of new apartments in 2022 dropped sharply in 2022, as tracked by RentCafe. Across the U.S., the average new apartment size was 887 sf, down 30 sf from 2021, which was the largest year-over-year decrease.


