

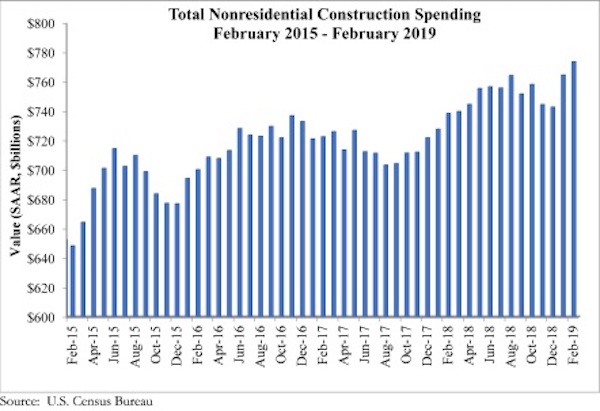
According to an Associated Builders and Contractors analysis of U.S. Census Bureau data released today, national nonresidential construction spending rose 1.2% in February. Seasonally adjusted nonresidential spending totaled $773.8 billion, a 4.8% increase over the same time last year.
Private nonresidential spending fell 0.5% for the month and is only up 0.1% on a year-over-year basis. Public nonresidential spending is up 3.7% for the month and an impressive 12.1% for the year. Highway and street (+9.6%), water supply (+5.2%) and sewage and waste disposal (+5%) spending experienced the largest monthly increases in February, while religious (-4%) and transportation (-3.8%) spending experienced the largest decreases.
“A number of economic readings have come in weaker than expected of late, including retail sales and February employment,” said ABC Chief Economist Anirban Basu. “Now private nonresidential construction has effectively flatlined during the past year, with spending virtually unchanged on a year-ago basis despite higher materials costs. This suggests that the actual physical amount of construction put in place has declined in real terms during the past year.
“As is often the case, it’s tempting to blame the weather,” said Basu. “It is absolutely true that the upper Midwest and New England were hit hard by precipitation and bitterly cold temperatures this winter, which undoubtedly suppressed some level of activity. However, softer growth in private nonresidential construction has been apparent for months. This is not a new phenomenon. Spending in the office, commercial and lodging categories was flat to declining in February.
“By contrast, public nonresidential construction spending was up sharply,” said Basu. “This strongly suggests that there is more at work than weather in terms of factors shaping the data. State and local government finances have continued to improve as the broader economy has expanded. America has generated job growth for 101 consecutive months, which has helped push income tax collections higher and unemployment insurance payments lower. Property values also have risen, as have sales tax collections.
“The standout is the highway and street category, which has experienced nearly 23% growth in spending on a year-over-year basis,” Basu added. “Policymakers also have been paying considerable attention to flood control (with conservation and development up 19% year over year) and water systems (with water supply up nearly 12%).”


Related Stories

Hotel Facilities | Jan 22, 2024
U.S. hotel construction is booming, with a record-high 5,964 projects in the pipeline
The hotel construction pipeline hit record project counts at Q4, with the addition of 260 projects and 21,287 rooms over last quarter, according to Lodging Econometrics.

Multifamily Housing | Jan 15, 2024
Multifamily rent growth rate unchanged at 0.3%
The National Multifamily Report by Yardi Matrix highlights the highs and lows of the multifamily market in 2023. Despite strong demand, rent growth remained unchanged at 0.3 percent.

Self-Storage Facilities | Jan 5, 2024
The state of self-storage in early 2024
As the housing market cools down, storage facilities suffer from lower occupancy and falling rates, according to the December 2023 Yardi Matrix National Self Storage Report.

Designers | Dec 25, 2023
Redefining the workplace is a central theme in Gensler’s latest Design Report
The firm identifies eight mega trends that mostly stress human connections.

Contractors | Dec 12, 2023
The average U.S. contractor has 8.5 months worth of construction work in the pipeline, as of November 2023
Associated Builders and Contractors reported today that its Construction Backlog Indicator inched up to 8.5 months in November from 8.4 months in October, according to an ABC member survey conducted Nov. 20 to Dec. 4. The reading is down 0.7 months from November 2022.

Market Data | Nov 27, 2023
Number of employees returning to the office varies significantly by city
While the return-to-the-office trend is felt across the country, the percentage of employees moving back to their offices varies significantly according to geography, according to Eptura’s Q3 Workplace Index.

Market Data | Nov 14, 2023
The average U.S. contractor has 8.4 months worth of construction work in the pipeline, as of September 2023
Associated Builders and Contractors reported that its Construction Backlog Indicator declined to 8.4 months in October from 9.0 months in September, according to an ABC member survey conducted from Oct. 19 to Nov. 2. The reading is down 0.4 months from October 2022. Backlog now stands at its lowest level since the first quarter of 2022.

Multifamily Housing | Nov 9, 2023
Multifamily project completions forecast to slow starting 2026
Yardi Matrix has released its Q4 2023 Multifamily Supply Forecast, emphasizing a short-term spike and plateau of new construction.

Contractors | Nov 1, 2023
Nonresidential construction spending increases for the 16th straight month, in September 2023
National nonresidential construction spending increased 0.3% in September, according to an Associated Builders and Contractors analysis of data published today by the U.S. Census Bureau. On a seasonally adjusted annualized basis, nonresidential spending totaled $1.1 trillion.

Market Data | Oct 23, 2023
New data finds that the majority of renters are cost-burdened
The most recent data derived from the 2022 Census American Community Survey reveals that the proportion of American renters facing housing cost burdens has reached its highest point since 2012, undoing the progress made in the ten years leading up to the pandemic.


