


The value of nonresidential building starts slightly fell in 2015, and was particularly soft in the latter months of the year, according to CMD Research Group.
The total value for nonresidential building stood at $186.307 billion in 2015, down 3.3% from 2014. Starts in December 2015 were 9.4% lower than the same month a year ago, and 7.3% lower than November 2015.
When heavy engineering, such as airport and highway construction, is thrown into the mix, the total value of nonresidential construction starts rose 1.9% to $309.221 billion. But heavy engineering, too, was softer in November and December.
The Industrial sector took the biggest hit last year, as manufacturing-related construction starts fell in value by 32.8% to $12.769 billion. Analysts have posited that manufacturing in the U.S. is suffering, in part, from the steady downturn in China’s economic growth.
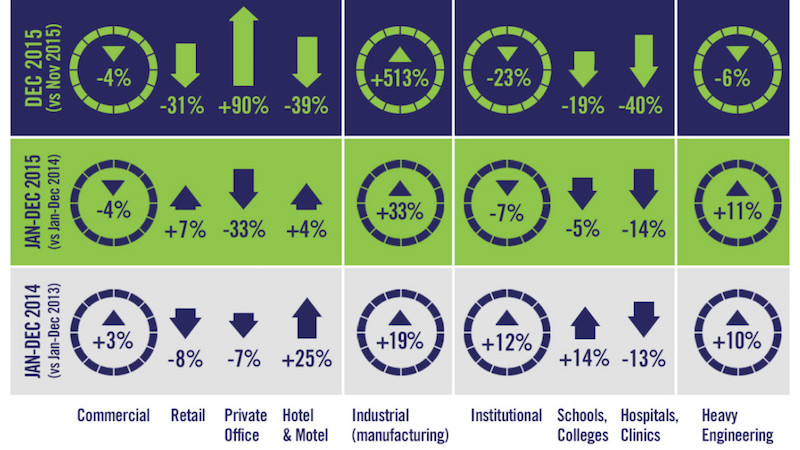 The last few months of 2015 were unkind to builders and developers, and pulled down the value of nonresidential construction starts, which ended the year up 1.9%. Nonresidential building starts were off 3.3%. Image courtesy of CMD Research Group.
Commercial construction was on shaky ground, too, as five of the 10 sectors that CMD tracks were negative. Private office building starts were down 32.6% to $11.828 billion, and the “amusement” category fell by 20.4% to $5.413 billion. On a positive note, Alex Carrick CMD’s chief economist, notes that commercial starts were buoyed by retail, which was down by 30.6% in December 2015 vs. December 2015, but still managed to show a positive full-year gain of 7.3% to $18.952 billion.
The wildest swing occurred in the warehouse sector, which cratered by 55.2% in December to December, but nonetheless finished full-year 2015 up 42.7% increase to $10.524 billion.
Schools and colleges accounted for 60% of the Institutional sector’s total starts. However, the category was off 18.7% in December compared to the same month in 2014, and down 4.5% for the full year, to $52.382 billion. The biggest institutional gainer was the police/prison/courthouse category, up 46.3% for the year to $5.664 billion.
CMD also provided a list of the 10 largest projects under construction in the U.S., led by the 40-story, $221 million mixed-use Milennium Tower in Boston. That’s followed by the 69-story commercial building at 401 9th Avenue in New York, whose start value CMD estimates at $317 million.
Related Stories

Market Data | Aug 4, 2017
U.S. grand total construction starts growth projection revised slightly downward
ConstructConnect’s quarterly report shows courthouses and sports stadiums to end 2017 with a flourish.

Market Data | Aug 2, 2017
Nonresidential Construction Spending falls in June, driven by public sector
June’s weak construction spending report can be largely attributed to the public sector.

Market Data | Jul 31, 2017
U.S. economic growth accelerates in second quarter; Nonresidential fixed investment maintains momentum
Nonresidential fixed investment, a category of GDP embodying nonresidential construction activity, expanded at a 5.2% seasonally adjusted annual rate.

Multifamily Housing | Jul 27, 2017
Apartment market index: Business conditions soften, but still solid
Despite some softness at the high end of the apartment market, demand for apartments will continue to be substantial for years to come, according to the National Multifamily Housing Council.

Market Data | Jul 25, 2017
What's your employer value proposition?
Hiring and retaining talent is one of the top challenges faced by most professional services firms.

Market Data | Jul 25, 2017
Moderating economic growth triggers construction forecast downgrade for 2017 and 2018
Prospects for the construction industry have weakened with developments over the first half of the year.

Industry Research | Jul 6, 2017
The four types of strategic real estate amenities
From swimming pools to pirate ships, amenities (even crazy ones) aren’t just perks, but assets to enhance performance.
Market Data | Jun 29, 2017
Silicon Valley, Long Island among the priciest places for office fitouts
Coming out on top as the most expensive market to build out an office is Silicon Valley, Calif., with an out-of-pocket cost of $199.22.

Market Data | Jun 26, 2017
Construction disputes were slightly less contentious last year
But poorly written and administered contracts are still problems, says latest Arcadis report.

Industry Research | Jun 26, 2017
Time to earn an architecture license continues to drop
This trend is driven by candidates completing the experience and examination programs concurrently and more quickly.


