


The value of nonresidential building starts slightly fell in 2015, and was particularly soft in the latter months of the year, according to CMD Research Group.
The total value for nonresidential building stood at $186.307 billion in 2015, down 3.3% from 2014. Starts in December 2015 were 9.4% lower than the same month a year ago, and 7.3% lower than November 2015.
When heavy engineering, such as airport and highway construction, is thrown into the mix, the total value of nonresidential construction starts rose 1.9% to $309.221 billion. But heavy engineering, too, was softer in November and December.
The Industrial sector took the biggest hit last year, as manufacturing-related construction starts fell in value by 32.8% to $12.769 billion. Analysts have posited that manufacturing in the U.S. is suffering, in part, from the steady downturn in China’s economic growth.
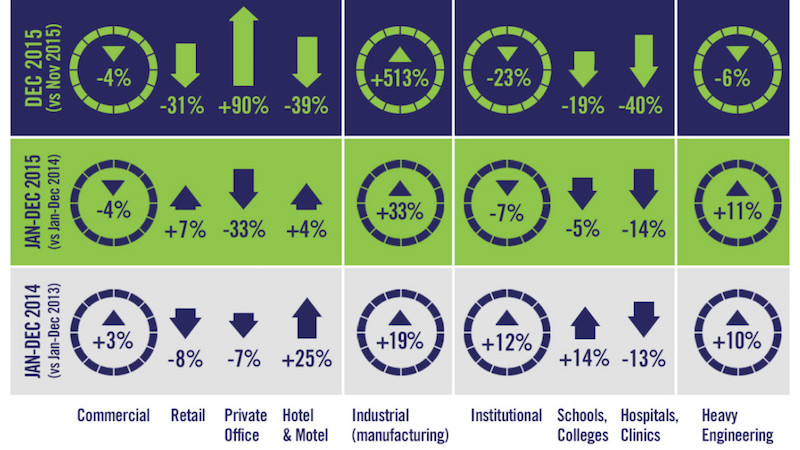 The last few months of 2015 were unkind to builders and developers, and pulled down the value of nonresidential construction starts, which ended the year up 1.9%. Nonresidential building starts were off 3.3%. Image courtesy of CMD Research Group.
Commercial construction was on shaky ground, too, as five of the 10 sectors that CMD tracks were negative. Private office building starts were down 32.6% to $11.828 billion, and the “amusement” category fell by 20.4% to $5.413 billion. On a positive note, Alex Carrick CMD’s chief economist, notes that commercial starts were buoyed by retail, which was down by 30.6% in December 2015 vs. December 2015, but still managed to show a positive full-year gain of 7.3% to $18.952 billion.
The wildest swing occurred in the warehouse sector, which cratered by 55.2% in December to December, but nonetheless finished full-year 2015 up 42.7% increase to $10.524 billion.
Schools and colleges accounted for 60% of the Institutional sector’s total starts. However, the category was off 18.7% in December compared to the same month in 2014, and down 4.5% for the full year, to $52.382 billion. The biggest institutional gainer was the police/prison/courthouse category, up 46.3% for the year to $5.664 billion.
CMD also provided a list of the 10 largest projects under construction in the U.S., led by the 40-story, $221 million mixed-use Milennium Tower in Boston. That’s followed by the 69-story commercial building at 401 9th Avenue in New York, whose start value CMD estimates at $317 million.
Related Stories

Multifamily Housing | May 10, 2017
May 2017 National Apartment Report
Median one-bedroom rent rose to $1,012 in April, the highest it has been since January.

Senior Living Design | May 9, 2017
Designing for a future of limited mobility
There is an accessibility challenge facing the U.S. An estimated 1 in 5 people will be aged 65 or older by 2040.

Industry Research | May 4, 2017
How your AEC firm can go from the shortlist to winning new business
Here are four key lessons to help you close more business.

Engineers | May 3, 2017
At first buoyed by Trump election, U.S. engineers now less optimistic about markets, new survey shows
The first quarter 2017 (Q1/17) of ACEC’s Engineering Business Index (EBI) dipped slightly (0.5 points) to 66.0.

Market Data | May 2, 2017
Nonresidential Spending loses steam after strong start to year
Spending in the segment totaled $708.6 billion on a seasonally adjusted, annualized basis.

Market Data | May 1, 2017
Nonresidential Fixed Investment surges despite sluggish economic in first quarter
Real gross domestic product (GDP) expanded 0.7 percent on a seasonally adjusted annualized rate during the first three months of the year.

Industry Research | Apr 28, 2017
A/E Industry lacks planning, but still spending large on hiring
The average 200-person A/E Firm is spending $200,000 on hiring, and not budgeting at all.

Market Data | Apr 19, 2017
Architecture Billings Index continues to strengthen
Balanced growth results in billings gains in all regions.

Market Data | Apr 13, 2017
2016’s top 10 states for commercial development
Three new states creep into the top 10 while first and second place remain unchanged.

Market Data | Apr 6, 2017
Architecture marketing: 5 tools to measure success
We’ve identified five architecture marketing tools that will help your firm evaluate if it’s on the track to more leads, higher growth, and broader brand visibility.


