


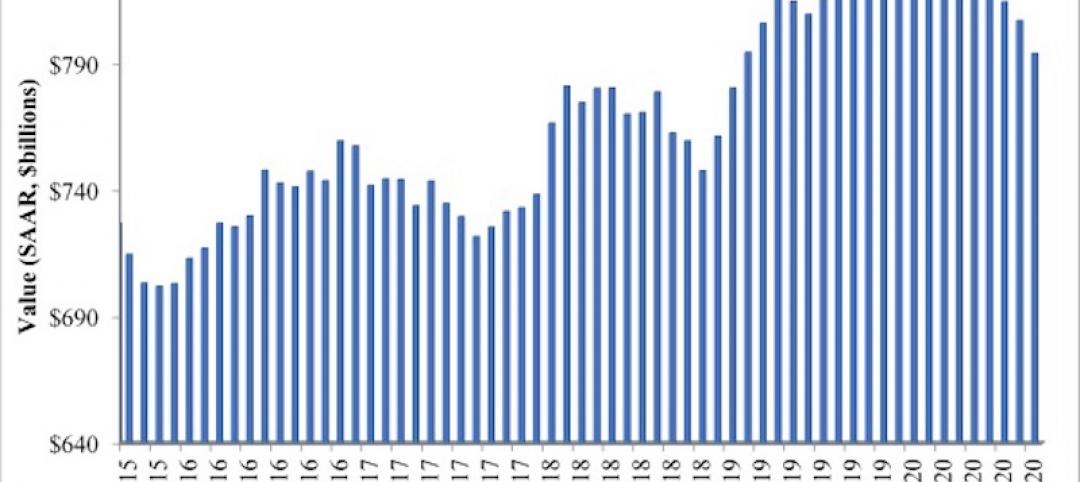
With all geographic regions and building project sectors showing positive conditions, there continues to be a heightened level of demand for design services signaled in the latest Architecture Billings Index (ABI). As a leading economic indicator of construction activity, the ABI reflects the approximate nine to twelve month lead time between architecture billings and construction spending. The American Institute of Architects (AIA) reported the August ABI score was 53.7, up from a score of 51.9 in the previous month. This score reflects an increase in design services provided by U.S. architecture firms (any score above 50 indicates an increase in billings). The new projects inquiry index was 62.5, up from a reading of 59.5 the previous month, while the new design contracts index eased somewhat from 56.4 to 54.2.
“The August results continue a string of very positive readings from the design professions, pointing to future healthy growth across the major construction sectors, as well as across the major regions of the country,” said AIA Chief Economist, Kermit Baker, Hon. AIA, PhD. “Given the focus and discussions around the infrastructure needs of the nation, we expect strong growth in design activity for the coming months and years.”
View this press release online here: https://www.aia.org/pres
Key August ABI highlights:
• Regional averages: South (55.7), Northeast (54.3), Midwest (52.5), West (51.3)
• Sector index breakdown: commercial / industrial (57.6), multi-family residential (53.8), mixed practice (52.5), institutional (50.1)
• Project inquiries index: 62.5
• Design contracts index: 54.2
The regional and sector categories are calculated as a 3-month moving average, whereas the national index, design contracts and inquiries are monthly numbers.
Related Stories
Market Data | Dec 2, 2020
Nonresidential construction spending remains flat in October
Residential construction expands as many commercial projects languish.
Market Data | Nov 30, 2020
New FEMA study projects implementing I-Codes could save $600 billion by 2060
International Code Council and FLASH celebrate the most comprehensive study conducted around hazard-resilient building codes to-date.

Market Data | Nov 23, 2020
Construction employment is down in three-fourths of states since February
This news comes even after 36 states added construction jobs in October.

Market Data | Nov 18, 2020
Architecture billings remained stalled in October
The pace of decline during October remained at about the same level as in September.

Market Data | Nov 17, 2020
Architects face data, culture gaps in fighting climate change
New study outlines how building product manufacturers can best support architects in climate action.

Market Data | Nov 10, 2020
Construction association ready to work with president-elect Biden to prepare significant new infrastructure and recovery measures
Incoming president and congress should focus on enacting measures to rebuild infrastructure and revive the economy.

Market Data | Nov 9, 2020
Construction sector adds 84,000 workers in October
A growing number of project cancellations risks undermining future industry job gains.
Market Data | Nov 4, 2020
Drop in nonresidential construction offsets most residential spending gains as growing number of contractors report cancelled projects
Association officials warn that demand for nonresidential construction will slide further without new federal relief measures.
Market Data | Nov 2, 2020
Nonresidential construction spending declines further in September
Among the sixteen nonresidential subcategories, thirteen were down on a monthly basis.

Market Data | Nov 2, 2020
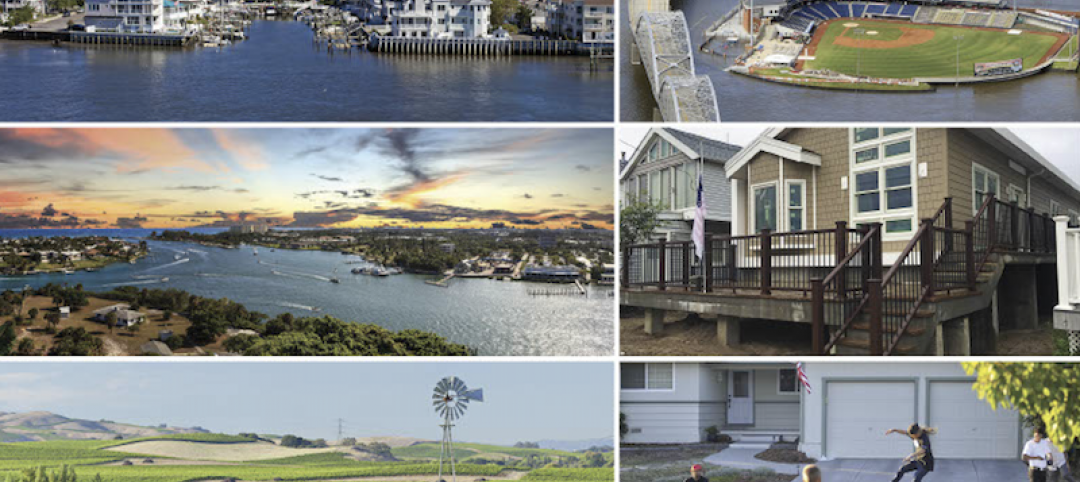
A white paper assesses seniors’ access to livable communities
The Joint Center for Housing Studies and AARP’s Public Policy Institute connect livability with income, race, and housing costs.


