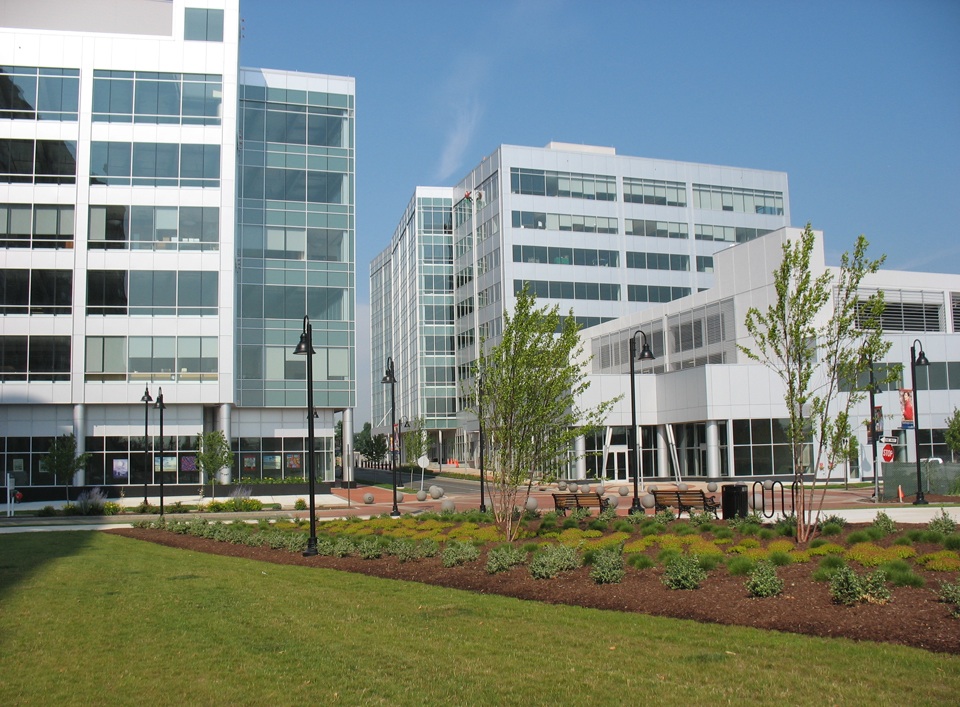
With an average cost per square foot of $16.11, Stamford, Conn., is the most costly U.S. market for commercial real estate, according to a new study by the Building Owners and Managers Association International. New York and San Francisco are also among the nation's priciest markets.
Using the results from the BOMA 2013 Experience Exchange Report, the group compiled a list of the most and least expensive commercial real estate city-markets in the United States. The annual report aggregates rental income and operating expense figures from the previous year; in 2012, data was gathered from more than 5,300 buildings across 250 markets and 115 cities in the United States and Canada.
Five most expensive city-markets – total operating expenses:
1. Stamford, Conn. $16.11 per square foot (psf)
2. New York $11.80 psf
3. Grand Rapids, Mich. $11.16 psf
4. Newark, N.J. $10.34 psf
5. San Francisco $9.66 psf
Five least expensive city-markets – total operating expenses:
1. Stockton, Calif. $3.57 psf
2. Fresno, Calif. $3.61 psf
3. Huntsville, Ala. $4.31 psf
4. Virginia Beach, Va. $4.64 psf
5. Albuquerque, N.M. $4.80 psf
Total operating expenses incorporate all expenses incurred to operate office buildings, including utilities, repairs and maintenance, roads and grounds, cleaning, administration, and security. Fixed expenses include real estate taxes, property taxes and insurance.
There was a 3.9 percent overall decrease in total operating expenses from 2011 to 2012, underscoring an industry focus on maximizing building efficiency in the face of dwindling income streams. For example, New York, which topped the list of most expensive markets for operating expenses last year, saw a decrease of $0.66 per square foot.
Five most expensive city-markets – total rental income:
1. Washington, D.C. $44.30 psf
2. New York $39.00 psf
3. San Mateo, Calif. $34.96 psf
4. San Francisco $34.49 psf
5. Santa Monica, Calif. $34.04 psf
Five least expensive city-markets – total rental income:
1. Macon, Ga. $8.16 psf
2. Shreveport, La. $11.18 psf
3. Columbus, Ohio $12.09 psf
4. Huntsville, Ala. $12.81 psf
5. Little Rock, Ark. $12.81 psf
Total rental income includes rental income from office, retail and other space, such as storage areas.
While average rental income has dropped somewhat, decreasing 2.9 percent from 2011 to 2012, building owners and managers are compensating for these income losses with greater reductions in expenses.
The Experience Exchange Report is the premier income and expense data benchmarking tool for the commercial real estate industry. The EER allows users to conduct multi-year analysis of single markets and select multiple cities to generate state and regional reports. It also offers the capability to search by building size, height, age and more for broader analysis. Subscriptions are available at www.bomaeer.com.
About BOMA International
The Building Owners and Managers Association (BOMA) International is a federation of 93 BOMA U.S. associations, BOMA Canada and its 11 regional associations and 13 BOMA international affiliates. Founded in 1907, BOMA represents the owners and managers of all commercial property types, including nearly 10 billion square feet of U.S. office space that supports 3.7 million jobs and contributes $205 billion to the U.S. GDP. Its mission is to advance the interests of the entire commercial real estate industry through advocacy, education, research, standards and information. Find BOMA online at www.boma.org.
Related Stories
| Aug 11, 2010
AGC unveils comprehensive plan to revive the construction industry
The Associated General Contractors of America unveiled a new plan today designed to revive the nation’s construction industry. The plan, “Build Now for the Future: A Blueprint for Economic Growth,” is designed to reverse predictions that construction activity will continue to shrink through 2010, crippling broader economic growth.
| Aug 11, 2010
High-profit design firms invest in in-house training
Forty-three percent of high-profit architecture, engineering, and environmental consulting firms have in-house training staff, according to a study by ZweigWhite. The 2008-2009 Successful Firm Survey reports that only 36% of firms overall have in-house training staff. In addition, 52% of high-profit firms use an online training system or service.
| Aug 11, 2010
Report: Fraud levels fall for construction industry, but companies still losing $6.4 million on average
The global construction, engineering and infrastructure industry saw a significant decline in fraud activity with companies losing an average of $6.4 million over the last three years, according to the latest edition of the Kroll Annual Global Fraud Report, released today at the Association of Corporate Counsel’s 2009 Annual Meeting in Boston. This new figure represents less than half of last year’s amount of $14.2 million.
| Aug 11, 2010
Davis Langdon, DEGW merge
Leading global construction consultancy Davis Langdon and strategic planning consultants DEGW have announced a merger
| Aug 11, 2010
Peter Marchetto joins Tishman as president of Construction Operations
Tishman Construction Corporation Chairman, Daniel R. Tishman, today announced that Peter Marchetto joined the company as President of Construction Operations.
| Aug 11, 2010
Jacobs, HDR top BD+C's ranking of the nation's 100 largest institutional building design firms
A ranking of the Top 100 Institutional Design Firms based on Building Design+Construction's 2009 Giants 300 survey. For more Giants 300 rankings, visit http://www.BDCnetwork.com/Giants


