

The U.S. office market continues to be one of the economy’s growth sectors, based on what the national real estate firm Transwestern gleans from the 48 of its markets that reported first-quarter results.
More than 45% of those markets—22, to be exact—registered improvements in direct vacancy, and 30 recorded increased in direct and sublet vacancy in the first quarter.
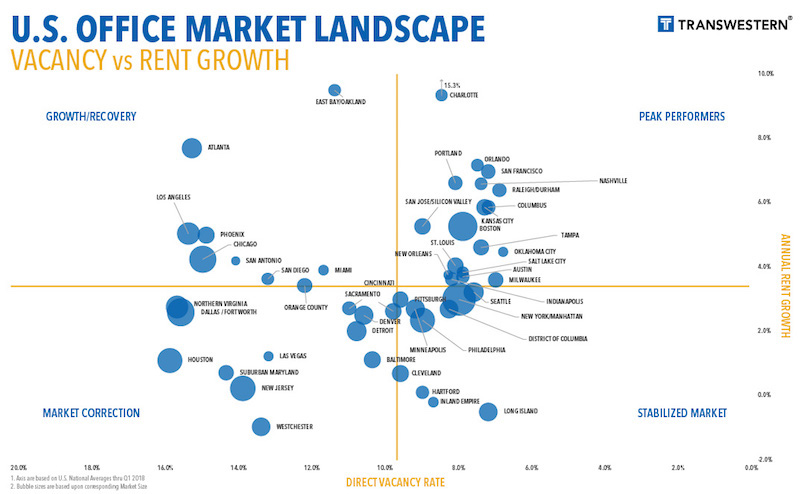
Overall, the office market’s vacancy rate, at 9.7% in the latest quarter, remained stable compared to the same period a year ago. And the vacancy rates were considerably lower in some of the country’s hottest real estate markets, such as Seattle (8.2%), Orlando (7.8%), Tampa (7.9%), and San Francisco (8.2%).
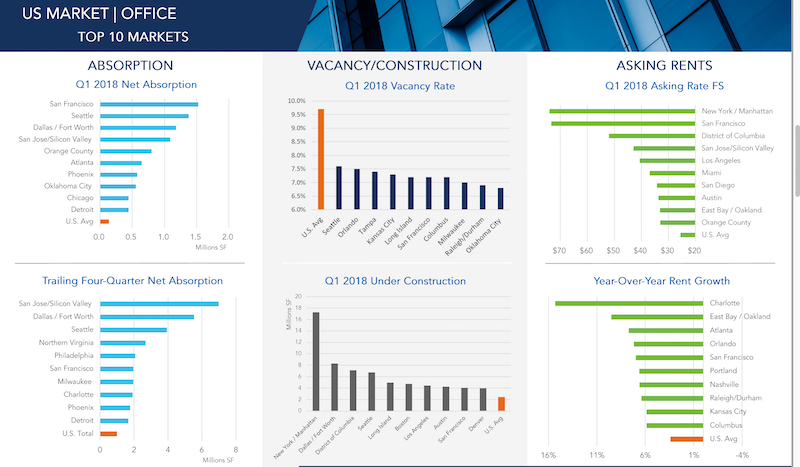
San Francisco was also the first-quarter leader in new absorptions, at more than 1.5 million sf, followed by Seattle, Dallas/Fort Worth, and San Jose, which was the leader in trailing four-quarters net absorption (nearly 7 million sf).
San Jose, Charlotte, Manhattan, and San Francisco were among the leading metros in terms of first-quarter office absorption and rent appreciation. Image: Transwestern U.S. Markets | Offices
All told, the U.S. market absorbed 14.1 million sf of office space in the first three months of 2018. That makes 31 consecutive quarters of positive absorption growth, although the absorption rate still lags three- and five-year quarterly averages.
Conversely, 1Q18 represented the fourth straight quarter of declines in new office construction, which stood at 141.1 million sf that period. Manhattan is by far and away the most active office construction market in the country, with nearly 18 million sf in starts in the first quarter. (Manhattan also has 432.9 million sf of office inventory, whose vacancy rate was 9.1%.) The next closest construction market, DFW, had 8.29 million sf in starts. (DFW’s vacancy rate was 16.7% in the first quarter.)
(The average new construction starts for Transwestern’s markets were 2 million sf.)
The number of office employees rose to 36 million, representing a 1.9% annual growth rate.
Transwestern states that the average asking rents continued to climb in the first quarter, marking the 20th consecutive month of increases. Charlotte, N.C., saw the biggest jump in asking rents, to 15.3%, followed by East Bay/Oakland, Calif. (9.5%) and Atlanta (7.7%).
Related Stories

Market Data | Apr 4, 2016
ABC: Nonresidential spending slip in February no cause for alarm
Spending in the nonresidential sector totaled $690.3 billion on a seasonally adjusted, annualized basis in February. The figure is a step back but still significantly higher than one year ago.

Market Data | Mar 30, 2016
10 trends for commercial real estate: JLL report
The report looks at global threats and opportunities, and how CRE firms are managing their expectations for growth.

Market Data | Mar 23, 2016
AIA: Modest expansion for Architecture Billings Index
Business conditions softening most in Midwest in recent months.

Retail Centers | Mar 16, 2016
Food and technology will help tomorrow’s malls survive, says CallisonRTKL
CallisonRTKL foresees future retail centers as hubs with live/work/play components.

Market Data | Mar 6, 2016
Real estate execs measure success by how well they manage ‘talent,’ costs, and growth
A new CBRE survey finds more companies leaning toward “smarter” workspaces.

Market Data | Mar 1, 2016
ABC: Nonresidential spending regains momentum in January
Nonresidential construction spending expanded 2.5% on a monthly basis and 12.3% on a yearly basis, totaling $701.9 billion. Spending increased in January in 10 of 16 nonresidential construction sectors.

Market Data | Mar 1, 2016
Leopardo releases 2016 Construction Economics Report
This year’s report shows that spending in 2015 reached the highest level since the Great Recession. Total spending on U.S. construction grew 10.5% to $1.1 trillion, the largest year-over-year gain since 2007.

Market Data | Feb 26, 2016
JLL upbeat about construction through 2016
Its latest report cautions about ongoing cost increases related to finding skilled laborers.

Market Data | Feb 17, 2016
AIA reports slight contraction in Architecture Billings Index
Multifamily residential sector improving after sluggish 2015.

Market Data | Feb 11, 2016
AIA: Continued growth expected in nonresidential construction
The American Institute of Architects’ semi-annual Consensus Construction Forecast indicates a growth of 8% in construction spending in 2016, and 6.7% the following year.


