

The U.S. office market continues to be one of the economy’s growth sectors, based on what the national real estate firm Transwestern gleans from the 48 of its markets that reported first-quarter results.
More than 45% of those markets—22, to be exact—registered improvements in direct vacancy, and 30 recorded increased in direct and sublet vacancy in the first quarter.
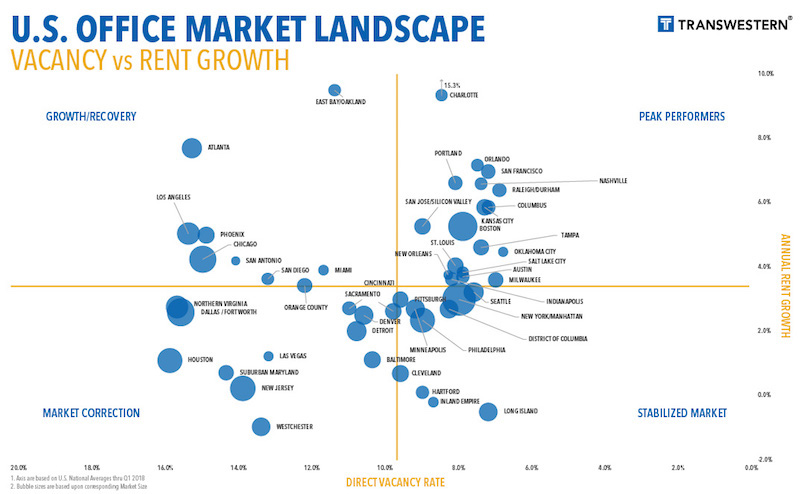
Overall, the office market’s vacancy rate, at 9.7% in the latest quarter, remained stable compared to the same period a year ago. And the vacancy rates were considerably lower in some of the country’s hottest real estate markets, such as Seattle (8.2%), Orlando (7.8%), Tampa (7.9%), and San Francisco (8.2%).
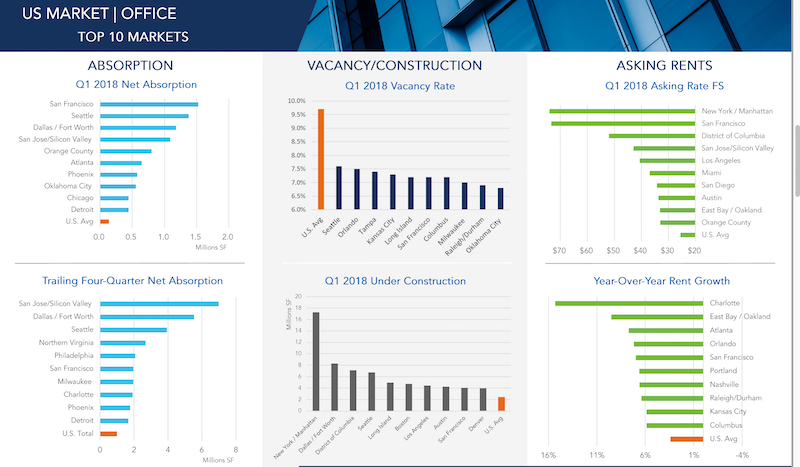
San Francisco was also the first-quarter leader in new absorptions, at more than 1.5 million sf, followed by Seattle, Dallas/Fort Worth, and San Jose, which was the leader in trailing four-quarters net absorption (nearly 7 million sf).
San Jose, Charlotte, Manhattan, and San Francisco were among the leading metros in terms of first-quarter office absorption and rent appreciation. Image: Transwestern U.S. Markets | Offices
All told, the U.S. market absorbed 14.1 million sf of office space in the first three months of 2018. That makes 31 consecutive quarters of positive absorption growth, although the absorption rate still lags three- and five-year quarterly averages.
Conversely, 1Q18 represented the fourth straight quarter of declines in new office construction, which stood at 141.1 million sf that period. Manhattan is by far and away the most active office construction market in the country, with nearly 18 million sf in starts in the first quarter. (Manhattan also has 432.9 million sf of office inventory, whose vacancy rate was 9.1%.) The next closest construction market, DFW, had 8.29 million sf in starts. (DFW’s vacancy rate was 16.7% in the first quarter.)
(The average new construction starts for Transwestern’s markets were 2 million sf.)
The number of office employees rose to 36 million, representing a 1.9% annual growth rate.
Transwestern states that the average asking rents continued to climb in the first quarter, marking the 20th consecutive month of increases. Charlotte, N.C., saw the biggest jump in asking rents, to 15.3%, followed by East Bay/Oakland, Calif. (9.5%) and Atlanta (7.7%).
Related Stories

Market Data | Nov 30, 2016
Marcum Commercial Construction Index reports industry outlook has shifted; more change expected
Overall nonresidential construction spending in September totaled $690.5 billion, down a slight 0.7 percent from a year earlier.

Industry Research | Nov 30, 2016
Multifamily millennials: Here is what millennial renters want in 2017
It’s all about technology and convenience when it comes to the things millennial renters value most in a multifamily facility.
Market Data | Nov 29, 2016
It’s not just traditional infrastructure that requires investment
A national survey finds strong support for essential community buildings.

Industry Research | Nov 28, 2016
Building America: The Merit Shop Scorecard
ABC releases state rankings on policies affecting construction industry.

Multifamily Housing | Nov 28, 2016
Axiometrics predicts apartment deliveries will peak by mid 2017
New York is projected to lead the nation next year, thanks to construction delays in 2016

Market Data | Nov 22, 2016
Construction activity will slow next year: JLL
Risk, labor, and technology are impacting what gets built.

Market Data | Nov 17, 2016
Architecture Billings Index rebounds after two down months
Decline in new design contracts suggests volatility in design activity to persist.

Market Data | Nov 11, 2016
Brand marketing: Why the B2B world needs to embrace consumers
The relevance of brand recognition has always been debatable in the B2B universe. With notable exceptions like BASF, few manufacturers or industry groups see value in generating top-of-mind awareness for their products and services with consumers.

Industry Research | Nov 8, 2016
Austin, Texas wins ‘Top City’ in the Emerging Trends in Real Estate outlook
Austin was followed on the list by Dallas/Fort Worth, Texas and Portland, Ore.

Market Data | Nov 2, 2016
Nonresidential construction spending down in September, but August data upwardly revised
The government revised the August nonresidential construction spending estimate from $686.6 billion to $696.6 billion.


