

At the end of the second quarter, analysts at Lodging Econometrics (LE) report that the total U.S. construction pipeline stands at 5,312 projects/634,501 rooms, up 7% from 2017’s 4,973 projects/598,371 rooms. The pipeline has been growing moderately and incrementally each quarter and should continue its upward growth trend as long as the economy remains strong. Pipeline totals are still significantly below the all-time high of 5,883 projects/785,547 rooms reached in 2008.
Projects scheduled to start construction in the next 12 months have seen minimal change year-over-year (YOY) with 2,291 projects/266,878 rooms. Projects currently under construction are at 1,594 projects/208,509 rooms, the highest recorded since 2007. This also marks the fourth consecutive quarter that the number of rooms under construction has been over 200,000 units.
Early planning with 1,427 projects/159,114 rooms, saw a 25% increase in projects and 18% increase in rooms YOY. This increase in early planning is typical late cycle activity where developers are anxious to move from the drawing board into the permitting phase prior to any economic slowdown. Many are larger projects that wait for peak operating performance in their markets before seeking financing.
Both the increase in projects under construction and those in the early planning stage are reflective of the urgency developers currently have before the economy softens and/or interest rates further accelerate.
The top five markets with the largest hotel construction pipelines are: New York City with 169 projects/29,365 rooms; Dallas with 156 projects/18, 908 rooms; Houston with 150 projects/16,321 rooms; Nashville with 123 projects/16,392 rooms; and Los Angeles with 121 projects/18,037 rooms.
The five top markets with the most projects currently under construction are New York City with 101 projects/17,108 rooms, Dallas with 47 projects/6,350 rooms, Nashville with 43 projects/7,005 rooms, Houston with 40 projects/4,738 rooms, and Atlanta with 28 projects/3,387 rooms.
In the second quarter, Nashville has the largest number of new projects announced into the pipeline with 13 projects/1,351 rooms, followed by Los Angeles with 12 projects/1,845 rooms, New York City with 11 projects/1,075 rooms, Houston with 11 projects/909 rooms, and Dallas with 10 projects/1,229 rooms. If all of the projects in their pipelines come to fruition, these leading markets will increase their current room supply by: Nashville 38.2%, Austin 29.3%, Fort Worth 28.5%, San Jose 25.3%, and New York City 25.2%.
Hotels forecast to open in 2018 are led by New York City with 45 projects/7,762 rooms, followed by Dallas with 33 projects/ 3,813 rooms, and then Houston with 27 projects/3,114 rooms. In 2019, New York is forecast to again top the list of new hotel openings with 52 projects/7,356 rooms while, at this time, Dallas is anticipated to take the lead in 2020 with 40 projects/4,943 rooms expected to open.
Related Stories
Multifamily Housing | Aug 12, 2016
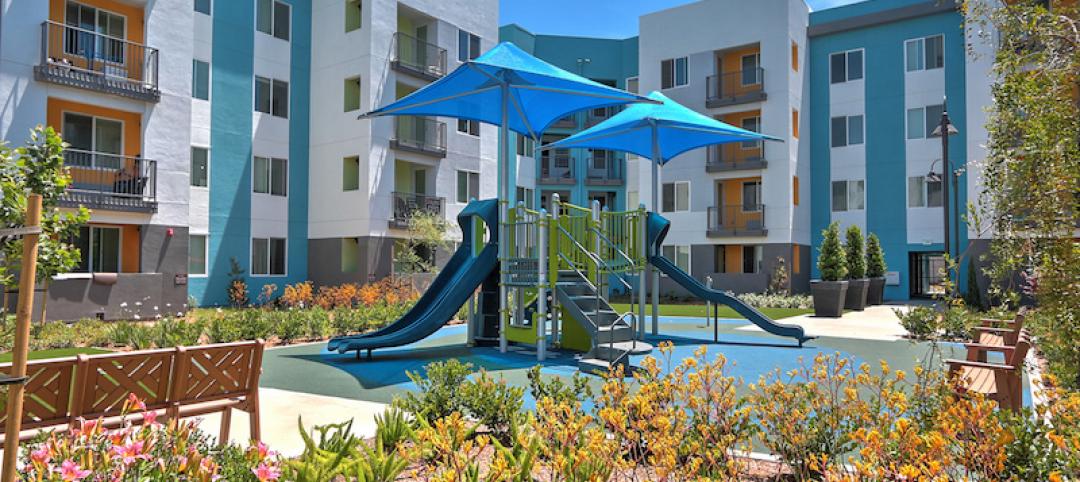
Apartment completions in largest metros on pace to increase by 50% in 2016
Texas is leading this multifamily construction boom, according to latest RENTCafé estimates.
Market Data | Jul 29, 2016
ABC: Output expands, but nonresidential fixed investment falters
Nonresidential fixed investment fell for a third consecutive quarter, as indicated by Bureau of Economic Analysis data.
Industry Research | Jul 26, 2016
AIA consensus forecast sees construction spending on rise through next year
But several factors could make the industry downshift.

Architects | Jul 20, 2016
AIA: Architecture Billings Index remains on solid footing
The June ABI score was down from May, but the figure was positive for the fifth consecutive month.

Market Data | Jul 7, 2016
Airbnb alleged to worsen housing crunch in New York City
Allegedly removing thousands of housing units from market, driving up rents.

Market Data | Jul 6, 2016
Construction spending falls 0.8% from April to May
The private and public sectors have a combined estimated seasonally adjusted annual rate of $1.14 trillion.
Market Data | Jul 6, 2016
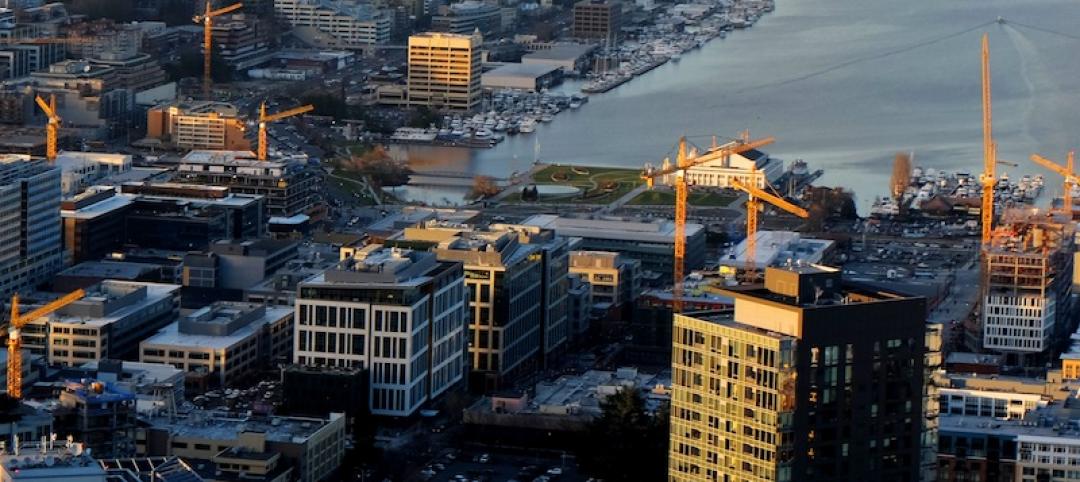
A thriving economy and influx of businesses spur construction in downtown Seattle
Development investment is twice what it was five years ago.

Multifamily Housing | Jul 5, 2016
Apartments continue to shrink, rents continue to rise
Latest survey by RENTCafé tracks size changes in 95 metros.
Multifamily Housing | Jun 22, 2016
Can multifamily construction keep up with projected demand?
The Joint Center for Housing Studies’ latest disection of America’s housing market finds moderate- and low-priced rentals in short supply.
Contractors | Jun 21, 2016
Bigness counts when it comes to construction backlogs
Large companies that can attract talent are better able to commit to more work, according to a national trade group for builders and contractors.


