


National nonresidential construction spending declined 0.4% in August, according to an Associated Builders and Contractors analysis of U.S. Census Bureau data published today. On a seasonally adjusted annualized basis, spending totaled $773.8 billion, 0.3% higher than in August 2018.
Private nonresidential spending fell 1% on a monthly basis and is down 2.8% compared to the same time last year. Public nonresidential construction expanded 0.4% for the month and 4.8% for the year.
"Nonresidential construction spending is down nearly 3% from its peak in April 2019 due to declines in private construction,” said ABC Chief Economist Anirban Basu. "Construction spending in the commercial category, which encompasses retail space among other segments, is down nearly 12% on a year-over-year basis. Spending related to lodging, including new hotel construction, was down 0.7% for the month and is up less than 4% year over year. Spending in the power segment also decreased in August and is down 3.5% compared to the same time last year."
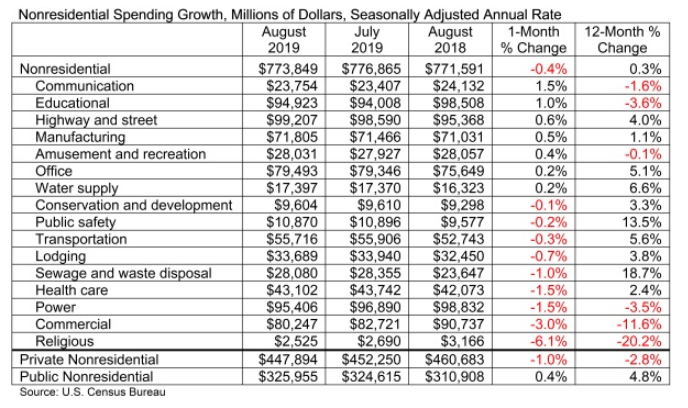
“All of this is consistent with a slowing economy, especially as measures such as industrial production and capacity utilization remain stagnant,” said Basu. “While this could be attributed to trade wars and a slowing global economy, construction dynamics are rarely so simple. Another likely explanation is that America’s growing shortage of skilled construction workers has driven up the cost of delivering construction services, even in the context of flat materials prices, resulting in more project owners delaying projects.
“On the other hand, public construction spending continues to rise,” said Basu. “Construction spending on public safety is up 13.5% on a year-over-year basis and spending in the sewage/waste disposal category is up nearly 19%. State and local governments continue to benefit from an economy that has pushed property tax, sales tax and income tax collections higher. Low borrowing costs also serve as an inducement to leverage revenues with debt, resulting in more infrastructure spending. Given the recent path of interest rates, this dynamic should continue into 2020.”
Related Stories

Data Centers | Jan 28, 2016
Top 10 markets for data center construction
JLL’s latest outlook foresees a maturation in certain metros.

Market Data | Jan 20, 2016
Nonresidential building starts sag in 2015
CDM Research finds only a few positive signs among the leading sectors.
Market Data | Jan 20, 2016
Architecture Billings Index ends year on positive note
While volatility persists, architecture firms reported healthy performance for 2015.

Market Data | Jan 15, 2016
ABC: Construction material prices continue free fall in December
In December, construction material prices fell for the sixth consecutive month. Prices have declined 7.2% since peaking in August 2014.

Market Data | Jan 13, 2016
Morgan Stanley bucks gloom and doom, thinks U.S. economy has legs through 2020
Strong job growth and dwindling consumer debt give rise to hope.

Hotel Facilities | Jan 13, 2016
Hotel construction should remain strong through 2017
More than 100,000 rooms could be delivered this year alone.

Market Data | Jan 6, 2016
Census Bureau revises 10 years’ worth of construction spending figures
The largest revisions came in the last two years and were largely upward.

Market Data | Jan 5, 2016
Majority of AEC firms saw growth in 2015, remain optimistic for 2016: BD+C survey
By all indications, 2015 was another solid year for U.S. architecture, engineering, and construction firms.

Market Data | Jan 5, 2016
Nonresidential construction spending falters in November
Only 4 of 16 subsectors showed gains

Market Data | Dec 15, 2015
AIA: Architecture Billings Index hits another bump
Business conditions show continued strength in South and West regions.


