

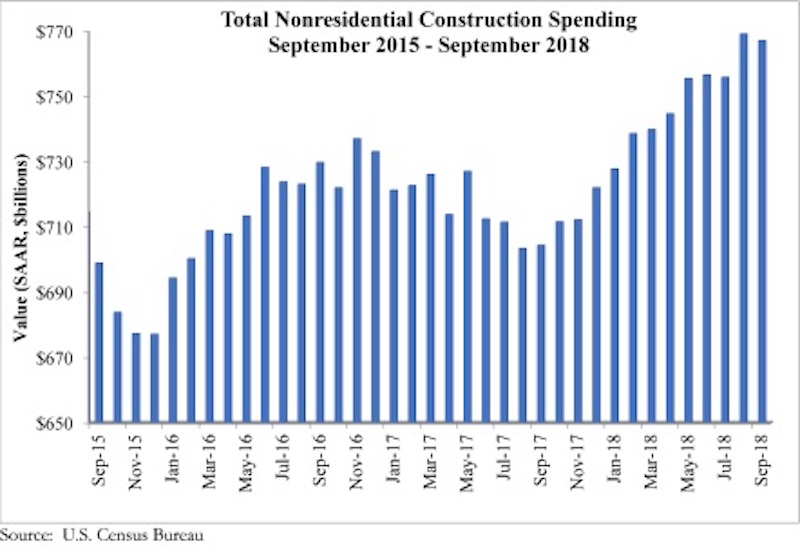
National nonresidential construction spending fell 0.3% in September but remains historically elevated, according to an Associated Builders and Contractors analysis of U.S. Census Bureau data released today. Total nonresidential spending stood at $767.1 billion on a seasonally adjusted, annualized rate in September, an increase of 8.9% on a year-ago basis.
Note that August’s estimate was revised almost a full percent higher from $762.7 billion to $769.1 billion, the highest level in the history of the series. Private nonresidential spending increased 0.1% in September while public nonresidential spending decreased 0.8% for the month.
“Virtually no weight should be placed upon the monthly decline in nonresidential construction spending that occurred in September,” said ABC Chief Economist Anirban Basu. “Rather, we should focus on the massive upward revision to August’s spending data. That revision finally aligns construction spending data with statistics on backlog, employment and other indicators of robust nonresidential construction spending. On a year-over-year basis, nonresidential construction is up nearly 9%, an impressive performance by any standard.
“Unlike previous instances of rapid construction growth, this one is led by a neatly balanced combination of private and public spending growth,” said Basu. “Among the leading sources of spending growth over the past year are water supply, transportation, lodging and office construction. This is not only consistent with an economy that continues to perform splendidly along multiple dimensions, but also with significantly improved state and local government finances, which has helped to support greater levels of infrastructure spending.
“Given healthy backlog and indications that the economy will continue to manifest momentum into 2019, contractors can expect to remain busy,” said Basu. “The most substantial challenges will continue to be rising workforce and input costs. That said, there are indications of softening business investment, which could serve to weaken U.S. economic growth after what is setting up to be a strong first half of 2019.”


Related Stories

Market Data | Oct 31, 2016
Nonresidential fixed investment expands again during solid third quarter
The acceleration in real GDP growth was driven by a combination of factors, including an upturn in exports, a smaller decrease in state and local government spending and an upturn in federal government spending, says ABC Chief Economist Anirban Basu.

Market Data | Oct 28, 2016
U.S. construction solid and stable in Q3 of 2016; Presidential election seen as influence on industry for 2017
Rider Levett Bucknall’s Third Quarter 2016 USA Construction Cost Report puts the complete spectrum of construction sectors and markets in perspective as it assesses the current state of the industry.

Industry Research | Oct 25, 2016
New HOK/CoreNet Global report explores impact of coworking on corporate real rstate
“Although coworking space makes up less than one percent of the world’s office space, it represents an important workforce trend and highlights the strong desire of today’s employees to have workplace choices, community and flexibility,” says Kay Sargent, Director of WorkPlace at HOK.

Market Data | Oct 24, 2016
New construction starts in 2017 to increase 5% to $713 billion
Dodge Outlook Report predicts moderate growth for most project types – single family housing, commercial and institutional building, and public works, while multifamily housing levels off and electric utilities/gas plants decline.

High-rise Construction | Oct 21, 2016
The world’s 100 tallest buildings: Which architects have designed the most?
Two firms stand well above the others when it comes to the number of tall buildings they have designed.

Market Data | Oct 19, 2016
Architecture Billings Index slips consecutive months for first time since 2012
“This recent backslide should act as a warning signal,” said AIA Chief Economist, Kermit Baker.

Market Data | Oct 11, 2016
Building design revenue topped $28 billion in 2015
Growing profitability at architecture firms has led to reinvestment and expansion

Market Data | Oct 4, 2016
Nonresidential spending slips in August
Public sector spending is declining faster than the private sector.

Industry Research | Oct 3, 2016
Structure Tone survey shows cost is still a major barrier to building green
Climate change, resilience and wellness are also growing concerns.

Industry Research | Sep 27, 2016
Sterling Risk Sentiment Index indicates risk exposure perception remains stable in construction industry
Nearly half (45%) of those polled say election year uncertainty has a negative effect on risk perception in the construction market.


