

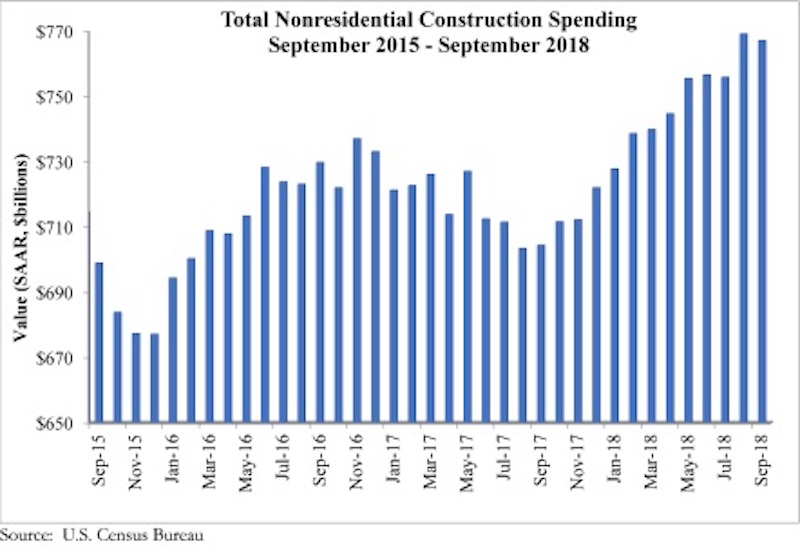
National nonresidential construction spending fell 0.3% in September but remains historically elevated, according to an Associated Builders and Contractors analysis of U.S. Census Bureau data released today. Total nonresidential spending stood at $767.1 billion on a seasonally adjusted, annualized rate in September, an increase of 8.9% on a year-ago basis.
Note that August’s estimate was revised almost a full percent higher from $762.7 billion to $769.1 billion, the highest level in the history of the series. Private nonresidential spending increased 0.1% in September while public nonresidential spending decreased 0.8% for the month.
“Virtually no weight should be placed upon the monthly decline in nonresidential construction spending that occurred in September,” said ABC Chief Economist Anirban Basu. “Rather, we should focus on the massive upward revision to August’s spending data. That revision finally aligns construction spending data with statistics on backlog, employment and other indicators of robust nonresidential construction spending. On a year-over-year basis, nonresidential construction is up nearly 9%, an impressive performance by any standard.
“Unlike previous instances of rapid construction growth, this one is led by a neatly balanced combination of private and public spending growth,” said Basu. “Among the leading sources of spending growth over the past year are water supply, transportation, lodging and office construction. This is not only consistent with an economy that continues to perform splendidly along multiple dimensions, but also with significantly improved state and local government finances, which has helped to support greater levels of infrastructure spending.
“Given healthy backlog and indications that the economy will continue to manifest momentum into 2019, contractors can expect to remain busy,” said Basu. “The most substantial challenges will continue to be rising workforce and input costs. That said, there are indications of softening business investment, which could serve to weaken U.S. economic growth after what is setting up to be a strong first half of 2019.”


Related Stories

Market Data | Apr 6, 2017
Architecture marketing: 5 tools to measure success
We’ve identified five architecture marketing tools that will help your firm evaluate if it’s on the track to more leads, higher growth, and broader brand visibility.

Market Data | Apr 3, 2017
Public nonresidential construction spending rebounds; overall spending unchanged in February
The segment totaled $701.9 billion on a seasonally adjusted annualized rate for the month, marking the seventh consecutive month in which nonresidential spending sat above the $700 billion threshold.

Market Data | Mar 29, 2017
Contractor confidence ends 2016 down but still in positive territory
Although all three diffusion indices in the survey fell by more than five points they remain well above the threshold of 50, which signals that construction activity will continue to be one of the few significant drivers of economic growth.

Market Data | Mar 24, 2017
These are the most and least innovative states for 2017
Connecticut, Virginia, and Maryland are all in the top 10 most innovative states, but none of them were able to claim the number one spot.

Market Data | Mar 22, 2017
After a strong year, construction industry anxious about Washington’s proposed policy shifts
Impacts on labor and materials costs at issue, according to latest JLL report.

Market Data | Mar 22, 2017
Architecture Billings Index rebounds into positive territory
Business conditions projected to solidify moving into the spring and summer.

Market Data | Mar 15, 2017
ABC's Construction Backlog Indicator fell to end 2016
Contractors in each segment surveyed all saw lower backlog during the fourth quarter, with firms in the heavy industrial segment experiencing the largest drop.

Market Data | Feb 28, 2017
Leopardo’s 2017 Construction Economics Report shows year-over-year construction spending increase of 4.2%
The pace of growth was slower than in 2015, however.

Market Data | Feb 23, 2017
Entering 2017, architecture billings slip modestly
Despite minor slowdown in overall billings, commercial/ industrial and institutional sectors post strongest gains in over 12 months.

Market Data | Feb 16, 2017
How does your hospital stack up? Grumman/Butkus Associates 2016 Hospital Benchmarking Survey
Report examines electricity, fossil fuel, water/sewer, and carbon footprint.


