

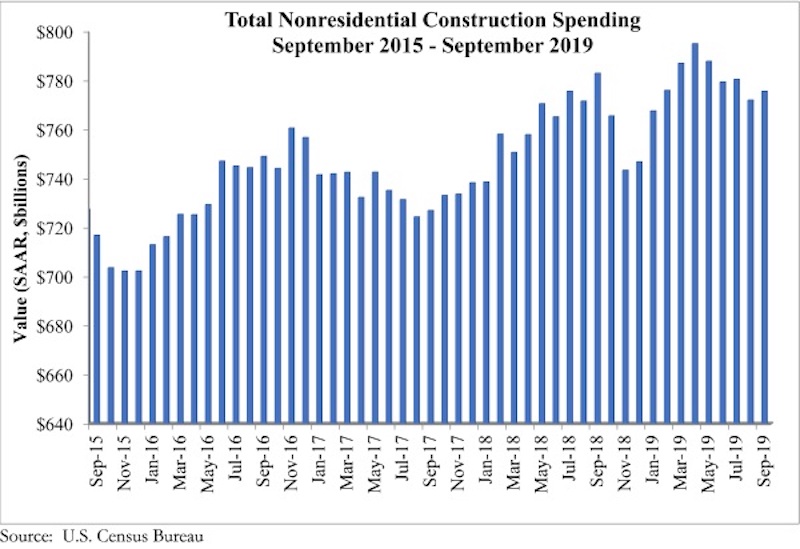
National nonresidential construction spending rose 0.5% in September but is down 0.9% on a year-ago basis, according to an Associated Builders and Contractors analysis of data published today by the U.S. Census Bureau. On a seasonally adjusted annualized basis, spending totaled $775.6 billion, 2.4% lower than the cyclical peak in April 2019.
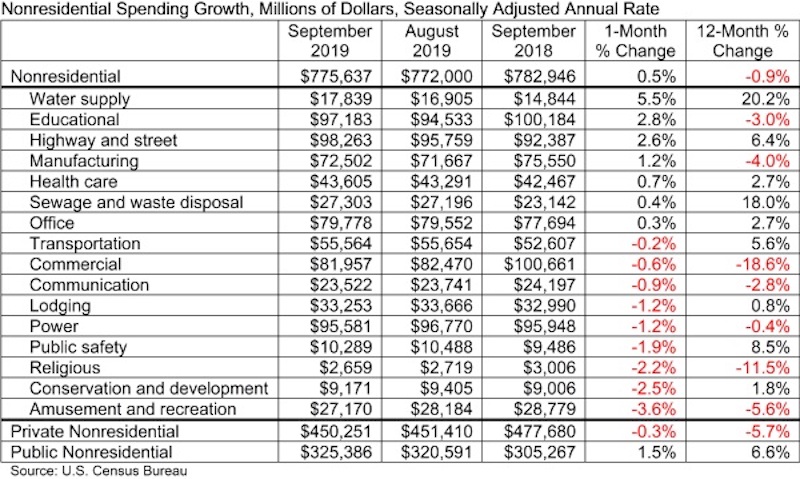
Private nonresidential spending fell 0.3% on a monthly basis and is down 5.7% compared to the same time last year, while public nonresidential construction spending expanded 1.5% for the month and is up 6.6% for the year. This comports neatly with today’s employment report and GDP data released earlier this week, which revealed ongoing growth in outlays for infrastructure but declining investment in structures.
“Construction spending contracted in a number of private segments, including in the commercial and lodging categories,” said ABC Chief Economist Anirban Basu. "While it would be easy to attribute this to a slowing economy and/or growing concerns regarding the saturation of available space in certain private segments, there are also large-scale economic transformations playing a role. Commercial construction spending is down nearly 19%, as traditional retailers continue to contend with the growing presence and capabilities of e-commerce giants, while those in the lodging segment—which dipped in September and is essentially flat year-over-year—are increasingly competing with online platforms such as Airbnb.
“Meanwhile, public construction remains one of the strongest elements of the U.S. economy,” said Basu. “Spending in the water supply category surged nearly 6% in September and is up 20% on a year-over-year basis. Overall, public nonresidential construction is up nearly 7% over the past 12 months as state and local government finances enjoy their best health in more than a decade. While there were some declines on a monthly basis in certain public segments in September, year-over-year spending is up more than 6% in the highway/street category, by nearly 6% in the transportation segment and by nearly 9% in the public safety category.
“Leading indicators, including the Architecture Billings Index, continue to point toward sluggish growth or worse in private construction,” said Basu. “Public construction spending, by contrast, should remain a source of economic expansion during the months ahead, but the looming insolvency of the Highway Trust Fund must be addressed soon for momentum to persist. In September, nine of 16 nonresidential construction segments experienced a decline in spending, and there has been a negative trend in place since April. Accordingly, viewed from a high-level perspective, the outlook for nonresidential construction spending is becoming increasingly uncertain, though available data regarding backlog suggest that the industry will enter 2020 with residual momentum.”

Related Stories

Market Data | Apr 11, 2023
Construction crane count reaches all-time high in Q1 2023
Toronto, Seattle, Los Angeles, and Denver top the list of U.S/Canadian cities with the greatest number of fixed cranes on construction sites, according to Rider Levett Bucknall's RLB Crane Index for North America for Q1 2023.

Contractors | Apr 11, 2023
The average U.S. contractor has 8.7 months worth of construction work in the pipeline, as of March 2023
Associated Builders and Contractors reported that its Construction Backlog Indicator declined to 8.7 months in March, according to an ABC member survey conducted March 20 to April 3. The reading is 0.4 months higher than in March 2022.

Market Data | Apr 6, 2023
JLL’s 2023 Construction Outlook foresees growth tempered by cost increases
The easing of supply chain snags for some product categories, and the dispensing with global COVID measures, have returned the North American construction sector to a sense of normal. However, that return is proving to be complicated, with the construction industry remaining exceptionally busy at a time when labor and materials cost inflation continues to put pricing pressure on projects, leading to caution in anticipation of a possible downturn. That’s the prognosis of JLL’s just-released 2023 U.S. and Canada Construction Outlook.

Market Data | Apr 4, 2023
Nonresidential construction spending up 0.4% in February 2023
National nonresidential construction spending increased 0.4% in February, according to an Associated Builders and Contractors analysis of data published by the U.S. Census Bureau. On a seasonally adjusted annualized basis, nonresidential spending totaled $982.2 billion for the month, up 16.8% from the previous year.

Multifamily Housing | Mar 24, 2023
Average size of new apartments dropped sharply in 2022
The average size of new apartments in 2022 dropped sharply in 2022, as tracked by RentCafe. Across the U.S., the average new apartment size was 887 sf, down 30 sf from 2021, which was the largest year-over-year decrease.

Multifamily Housing | Mar 14, 2023
Multifamily housing rent rates remain flat in February 2023
Multifamily housing asking rents remained the same for a second straight month in February 2023, at a national average rate of $1,702, according to the new National Multifamily Report from Yardi Matrix. As the economy continues to adjust in the post-pandemic period, year-over-year growth continued its ongoing decline.

Contractors | Mar 14, 2023
The average U.S. contractor has 9.2 months worth of construction work in the pipeline, as of February 2023
Associated Builders and Contractors reported today that its Construction Backlog Indicator increased to 9.2 months in February, according to an ABC member survey conducted Feb. 20 to March 6. The reading is 1.2 months higher than in February 2022.

Industry Research | Mar 9, 2023
Construction labor gap worsens amid more funding for new infrastructure, commercial projects
The U.S. construction industry needs to attract an estimated 546,000 additional workers on top of the normal pace of hiring in 2023 to meet demand for labor, according to a model developed by Associated Builders and Contractors. The construction industry averaged more than 390,000 job openings per month in 2022.

Market Data | Mar 7, 2023
AEC employees are staying with firms that invest in their brand
Hinge Marketing’s latest survey explores workers’ reasons for leaving, and offers strategies to keep them in the fold.

Multifamily Housing | Feb 21, 2023
Multifamily housing investors favoring properties in the Sun Belt
Multifamily housing investors are gravitating toward Sun Belt markets with strong job and population growth, according to new research from Yardi Matrix. Despite a sharp second-half slowdown, last year’s nationwide $187 billion transaction volume was the second-highest annual total ever.


