

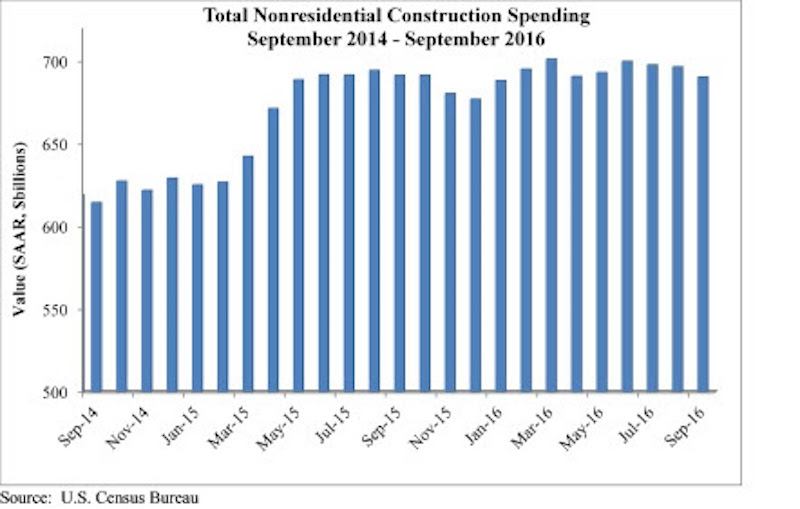
Nonresidential construction spending fell 0.9 percent from August to September 2016, according to analysis of U.S. Census Bureau data released today by Associated Builders and Contractors (ABC). Nonresidential spending totaled $690.5 billion on a seasonally adjusted, annualized basis for the month, 0.7 percent below September 2015’s figure.
The government revised the August nonresidential construction spending estimate from $686.6 billion to $696.6 billion; otherwise September spending would have risen on a month-over-month basis. Eleven of 16 nonresidential construction subsectors experienced monthly declines.
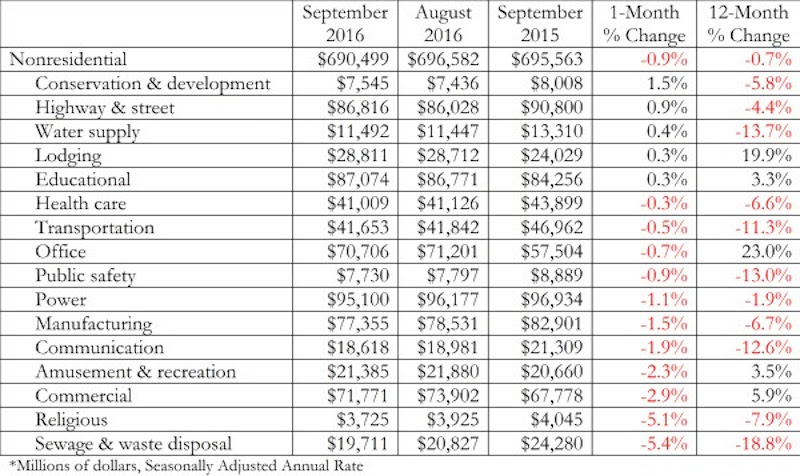
“A number of primarily publicly financed construction segments have experienced declines in spending over the past year, including sewage and waste disposal (-18.8%), water supply (-13.7%), public safety (-13.0%) and transportation (-11.3%). Meanwhile, the level of construction spending in office, lodging and commercial segments is up on a year-over-year basis, though spending in the office and commercial categories was down on a month-over-month basis and lodging-related construction was roughly flat,” says ABC Chief Economist Anirban Basu. “Nonresidential construction spending growth may not accelerate anytime soon, though there is some hope that the period following the elections will usher forth a period of renewed spending growth."

Related Stories

Market Data | Apr 20, 2021
Demand for design services continues to rapidly escalate
AIA’s ABI score for March rose to 55.6 compared to 53.3 in February.

Market Data | Apr 16, 2021
Construction employment in March trails March 2020 mark in 35 states
Nonresidential projects lag despite hot homebuilding market.

Market Data | Apr 13, 2021
ABC’s Construction Backlog slips in March; Contractor optimism continues to improve
The Construction Backlog Indicator fell to 7.8 months in March.

Market Data | Apr 9, 2021
Record jump in materials prices and supply chain distributions threaten construction firms' ability to complete vital nonresidential projects
A government index that measures the selling price for goods used construction jumped 3.5% from February to March.

Contractors | Apr 9, 2021
Construction bidding activity ticks up in February
The Blue Book Network's Velocity Index measures month-to-month changes in bidding activity among construction firms across five building sectors and in all 50 states.

Industry Research | Apr 9, 2021
BD+C exclusive research: What building owners want from AEC firms
BD+C’s first-ever owners’ survey finds them focused on improving buildings’ performance for higher investment returns.

Market Data | Apr 7, 2021
Construction employment drops in 236 metro areas between February 2020 and February 2021
Houston-The Woodlands-Sugar Land and Odessa, Texas have worst 12-month employment losses.

Market Data | Apr 2, 2021
Nonresidential construction spending down 1.3% in February, says ABC
On a monthly basis, spending was down in 13 of 16 nonresidential subcategories.

Market Data | Apr 1, 2021
Construction spending slips in February
Shrinking demand, soaring costs, and supply delays threaten project completion dates and finances.

Market Data | Mar 26, 2021
Construction employment in February trails pre-pandemic level in 44 states
Soaring costs, supply-chain problems jeopardize future jobs.


