

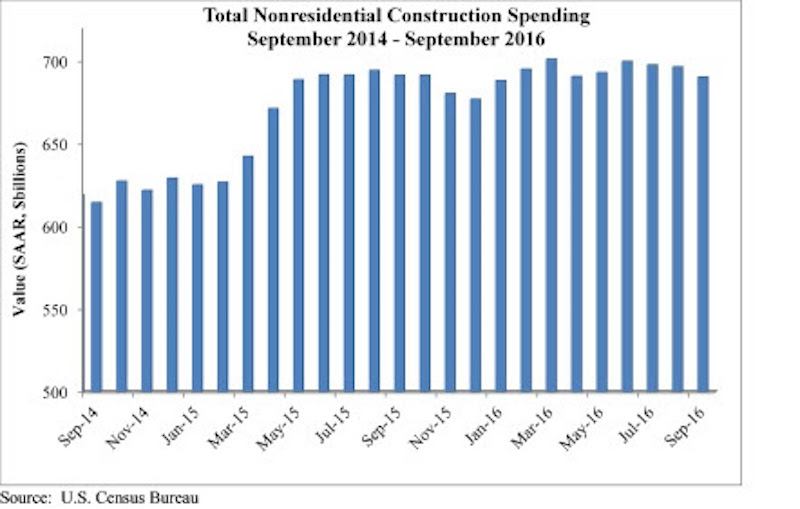
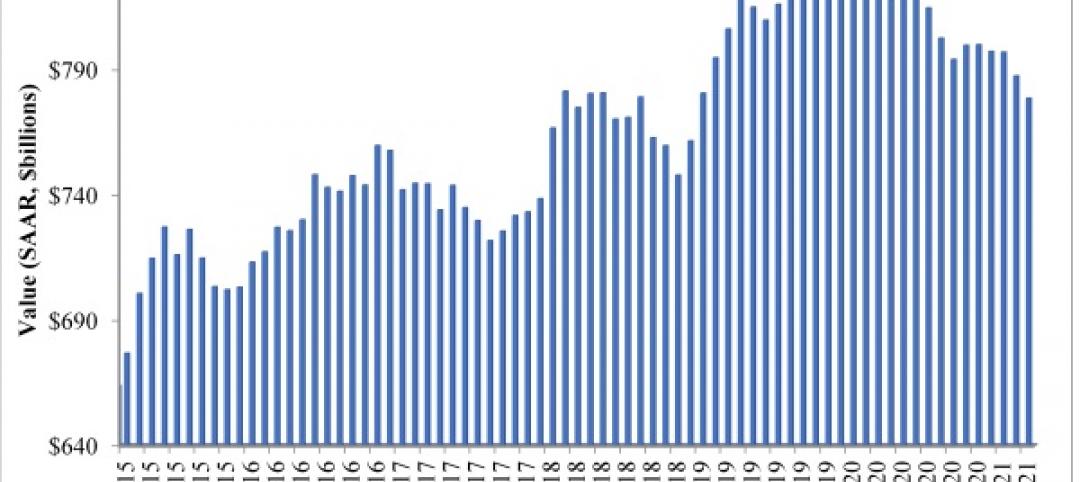
Nonresidential construction spending fell 0.9 percent from August to September 2016, according to analysis of U.S. Census Bureau data released today by Associated Builders and Contractors (ABC). Nonresidential spending totaled $690.5 billion on a seasonally adjusted, annualized basis for the month, 0.7 percent below September 2015’s figure.
The government revised the August nonresidential construction spending estimate from $686.6 billion to $696.6 billion; otherwise September spending would have risen on a month-over-month basis. Eleven of 16 nonresidential construction subsectors experienced monthly declines.
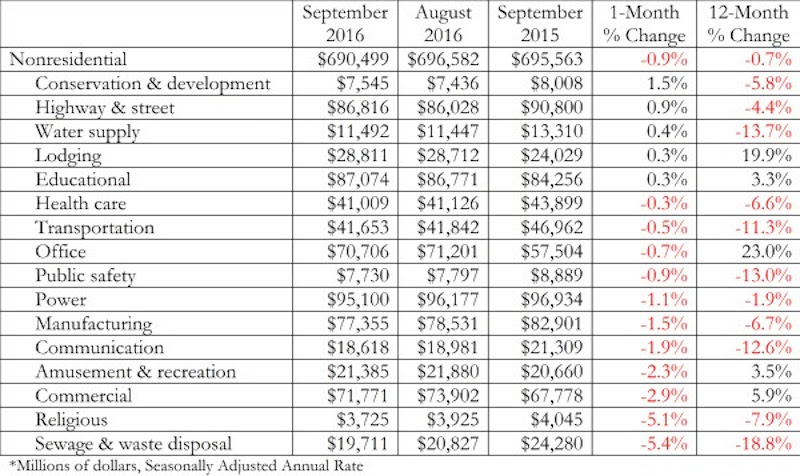
“A number of primarily publicly financed construction segments have experienced declines in spending over the past year, including sewage and waste disposal (-18.8%), water supply (-13.7%), public safety (-13.0%) and transportation (-11.3%). Meanwhile, the level of construction spending in office, lodging and commercial segments is up on a year-over-year basis, though spending in the office and commercial categories was down on a month-over-month basis and lodging-related construction was roughly flat,” says ABC Chief Economist Anirban Basu. “Nonresidential construction spending growth may not accelerate anytime soon, though there is some hope that the period following the elections will usher forth a period of renewed spending growth."

Related Stories

Multifamily Housing | May 18, 2021
Multifamily housing sector sees near record proposal activity in early 2021
The multifamily sector led all housing submarkets, and was third among all 58 submarkets tracked by PSMJ in the first quarter of 2021.
Market Data | May 18, 2021
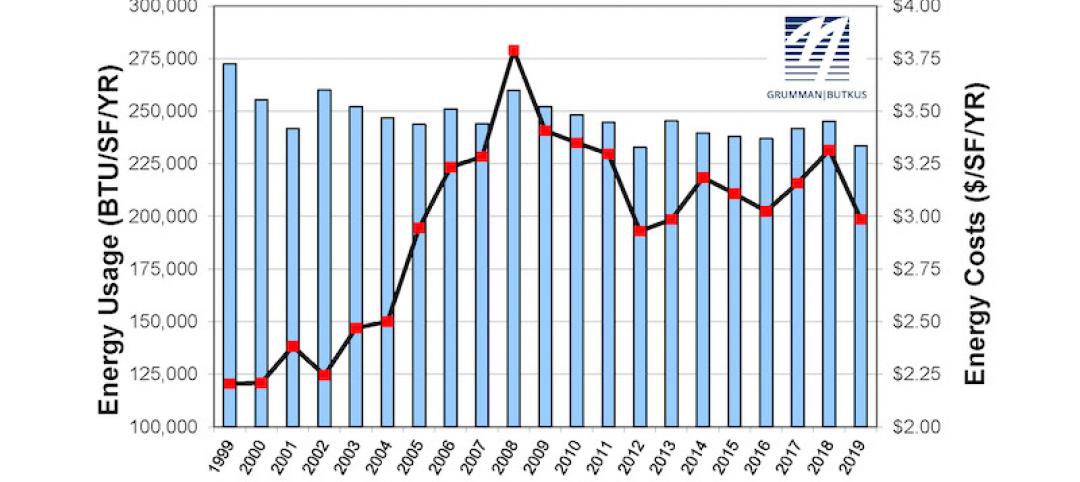
Grumman|Butkus Associates publishes 2020 edition of Hospital Benchmarking Survey
The report examines electricity, fossil fuel, water/sewer, and carbon footprint.
Market Data | May 13, 2021
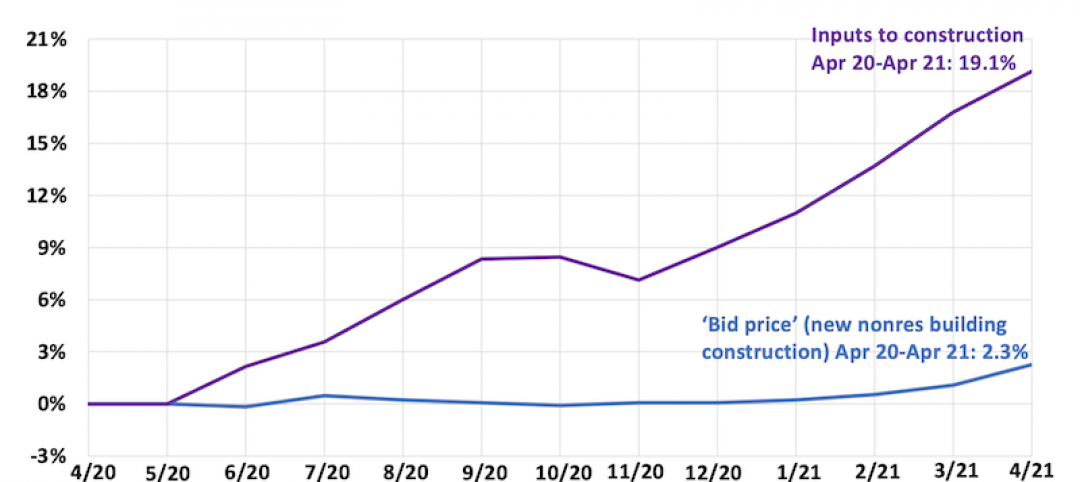
Proliferating materials price increases and supply chain disruptions squeeze contractors and threaten to undermine economic recovery
Producer price index data for April shows wide variety of materials with double-digit price increases.
Market Data | May 7, 2021
Construction employment stalls in April
Soaring costs, supply-chain challenges, and workforce shortages undermine industry's recovery.
Market Data | May 4, 2021
Nonresidential construction outlays drop in March for fourth-straight month
Weak demand, supply-chain woes make further declines likely.
Market Data | May 3, 2021
Nonresidential construction spending decreases 1.1% in March
Spending was down on a monthly basis in 11 of the 16 nonresidential subcategories.

Market Data | Apr 30, 2021
New York City market continues to lead the U.S. Construction Pipeline
New York City has the greatest number of projects under construction with 110 projects/19,457 rooms.

Market Data | Apr 29, 2021
U.S. Hotel Construction pipeline beings 2021 with 4,967 projects/622,218 rooms at Q1 close
Although hotel development may still be tepid in Q1, continued government support and the extension of programs has aided many businesses to get back on their feet as more and more are working to re-staff and re-open.
Market Data | Apr 28, 2021
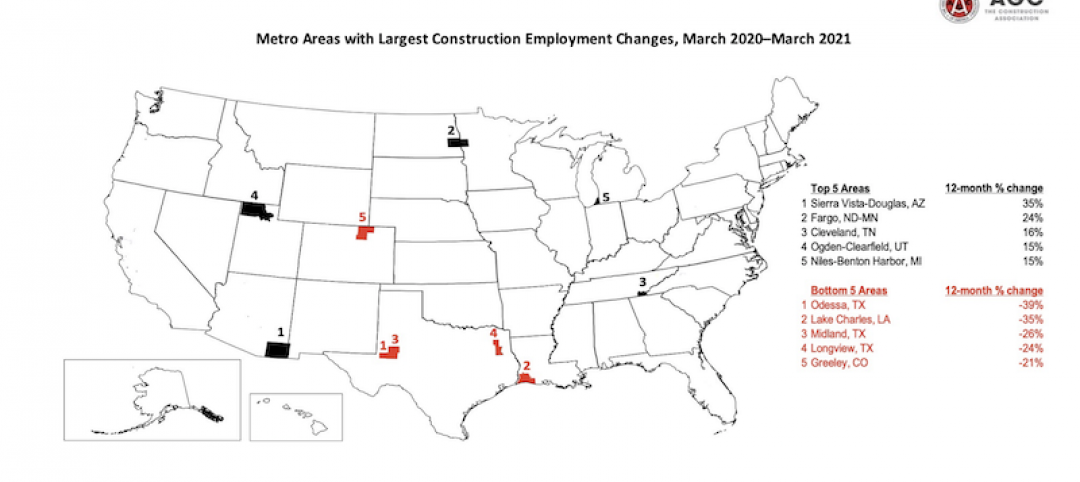
Construction employment declines in 203 metro areas from March 2020 to March 2021
The decline occurs despite homebuilding boom and improving economy.
Market Data | Apr 20, 2021
The pandemic moves subs and vendors closer to technology
Consigli’s latest market outlook identifies building products that are high risk for future price increases.


