

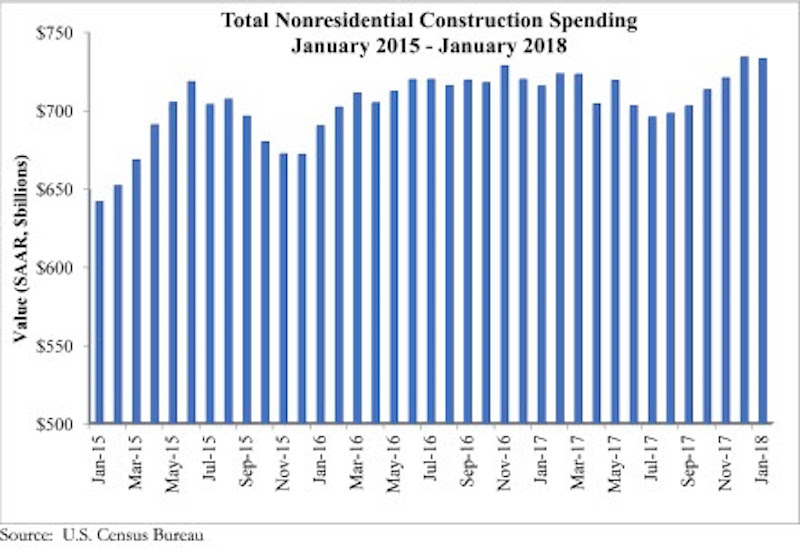
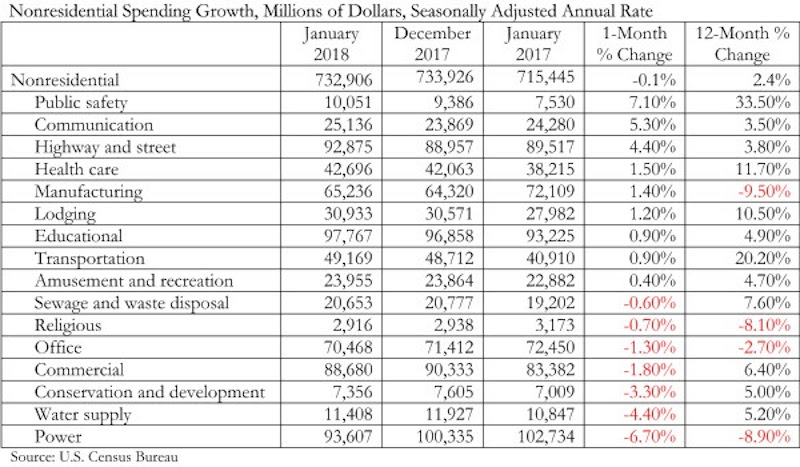
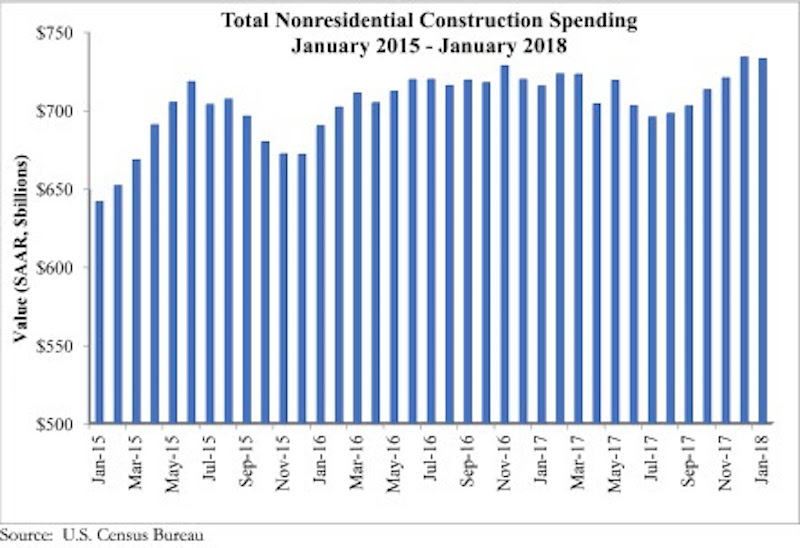
Nonresidential construction spending fell 0.1% on a monthly basis in January 2018, while year-over-year spending increased, according to an Associated Builders and Contractors (ABC) analysis of U.S. Census Bureau data released March 1. Nonresidential January spending totaled $732.9 billion on a seasonally adjusted annual rate, adding up to a 2.4% increase year over year.
Private nonresidential construction fell 1.5% for the month, while public sector nonresidential spending increased 1.9%. The largest year-over-year increases occurred in public safety (33.5%) and transportation (20.2%).
“Today’s data indicates that nonresidential spending continues to expand erratically and unevenly,” said ABC’s Chief Economist Anirban Basu. “On a monthly basis, nonresidential construction spending declined in January. While the decline was minimal, and may have been primarily attributable to freezing temperatures in much of the country, there has been a long-lived pattern of occasional spending setbacks in the context of broader expansion cycles. The result of the most recent spending setback is that nonresidential construction outlays are only 2.4% above year-ago levels.
“Interestingly, there is evidence of a reversal of fortune as spending picks up in certain public segments while flattening out in certain private ones,” said Basu. “With the housing market recovering, property tax and other forms of real estate tax collections have increased. This has positioned a growing number of public agencies to step up construction spending in education, public safety and other publicly financed categories.
“Meanwhile, there are growing concerns regarding excess inventory of commercial and office space in certain metropolitan areas,” said Basu. “This may help explain recent construction spending setbacks in a variety of privately financed construction segments. That said, there is little reason to believe that private construction will falter in 2018. Economic growth, including job growth, remains robust. Confidence is surging among many economic actors, including bankers and developers. The combination of capital and confidence should be enough to drive spending growth in most private segments as 2018 progresses.”
Related Stories

Market Data | Jun 21, 2017
Design billings maintain solid footing, strong momentum reflected in project inquiries/design contracts
Balanced growth results in billings gains in all sectors.

Market Data | Jun 16, 2017
Residential construction was strong, but not enough, in 2016
The Joint Center for Housing Studies’ latest report expects minorities and millennials to account for the lion’s share of household formations through 2035.

Industry Research | Jun 15, 2017
Commercial Construction Index indicates high revenue and employment expectations for 2017
USG Corporation (USG) and U.S. Chamber of Commerce release survey results gauging confidence among industry leaders.

Market Data | Jun 2, 2017
Nonresidential construction spending falls in 13 of 16 segments in April
Nonresidential construction spending fell 1.7% in April 2017, totaling $696.3 billion on a seasonally adjusted, annualized basis, according to analysis of U.S. Census Bureau data released today by Associated Builders and Contractors.

Industry Research | May 25, 2017
Project labor agreement mandates inflate cost of construction 13%
Ohio schools built under government-mandated project labor agreements (PLAs) cost 13.12 percent more than schools that were bid and constructed through fair and open competition.

Market Data | May 24, 2017
Design billings increasing entering height of construction season
All regions report positive business conditions.

Market Data | May 24, 2017
The top franchise companies in the construction pipeline
3 franchise companies comprise 65% of all rooms in the Total Pipeline.

Industry Research | May 24, 2017
These buildings paid the highest property taxes in 2016
Office buildings dominate the list, but a residential community climbed as high as number two on the list.

Market Data | May 16, 2017
Construction firms add 5,000 jobs in April
Unemployment down to 4.4%; Specialty trade jobs dip slightly.

Multifamily Housing | May 10, 2017
May 2017 National Apartment Report
Median one-bedroom rent rose to $1,012 in April, the highest it has been since January.


