

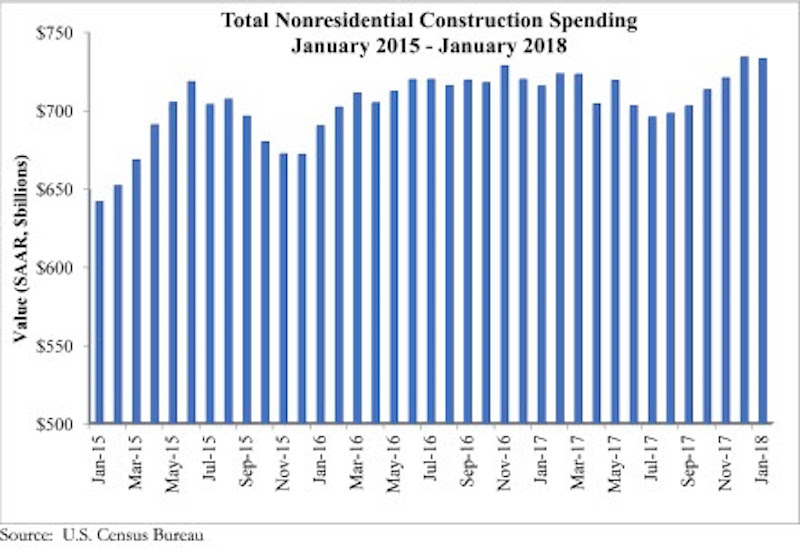
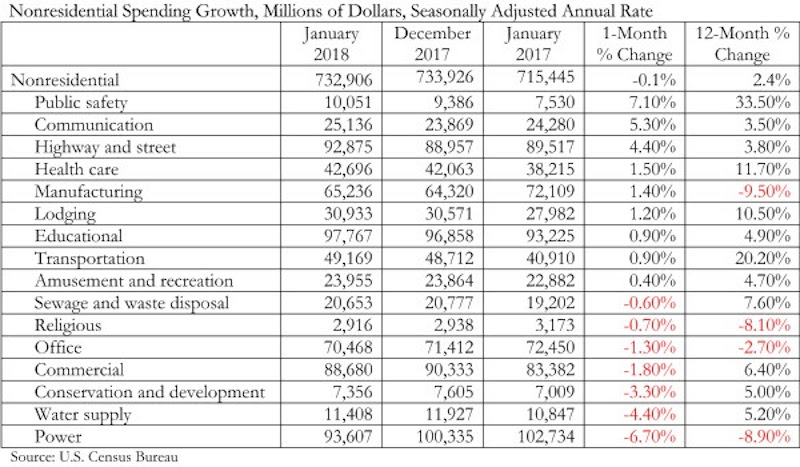
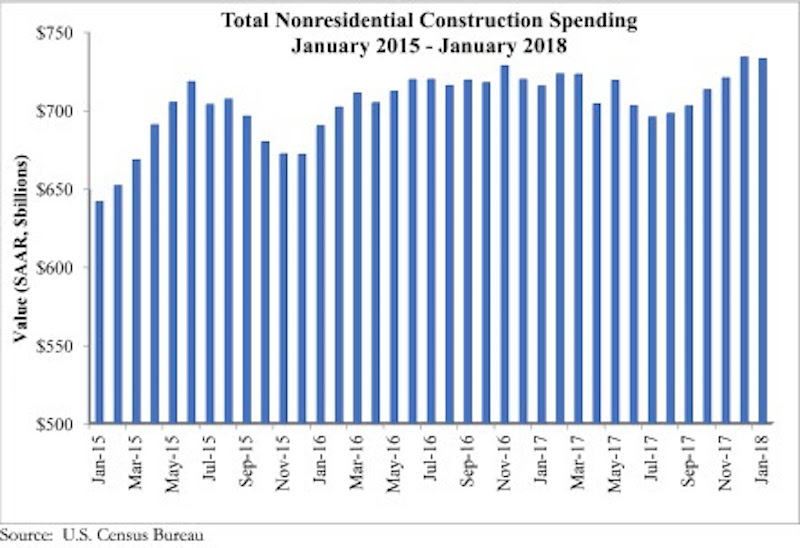
Nonresidential construction spending fell 0.1% on a monthly basis in January 2018, while year-over-year spending increased, according to an Associated Builders and Contractors (ABC) analysis of U.S. Census Bureau data released March 1. Nonresidential January spending totaled $732.9 billion on a seasonally adjusted annual rate, adding up to a 2.4% increase year over year.
Private nonresidential construction fell 1.5% for the month, while public sector nonresidential spending increased 1.9%. The largest year-over-year increases occurred in public safety (33.5%) and transportation (20.2%).
“Today’s data indicates that nonresidential spending continues to expand erratically and unevenly,” said ABC’s Chief Economist Anirban Basu. “On a monthly basis, nonresidential construction spending declined in January. While the decline was minimal, and may have been primarily attributable to freezing temperatures in much of the country, there has been a long-lived pattern of occasional spending setbacks in the context of broader expansion cycles. The result of the most recent spending setback is that nonresidential construction outlays are only 2.4% above year-ago levels.
“Interestingly, there is evidence of a reversal of fortune as spending picks up in certain public segments while flattening out in certain private ones,” said Basu. “With the housing market recovering, property tax and other forms of real estate tax collections have increased. This has positioned a growing number of public agencies to step up construction spending in education, public safety and other publicly financed categories.
“Meanwhile, there are growing concerns regarding excess inventory of commercial and office space in certain metropolitan areas,” said Basu. “This may help explain recent construction spending setbacks in a variety of privately financed construction segments. That said, there is little reason to believe that private construction will falter in 2018. Economic growth, including job growth, remains robust. Confidence is surging among many economic actors, including bankers and developers. The combination of capital and confidence should be enough to drive spending growth in most private segments as 2018 progresses.”
Related Stories

Hotel Facilities | Jan 22, 2024
U.S. hotel construction is booming, with a record-high 5,964 projects in the pipeline
The hotel construction pipeline hit record project counts at Q4, with the addition of 260 projects and 21,287 rooms over last quarter, according to Lodging Econometrics.

Multifamily Housing | Jan 15, 2024
Multifamily rent growth rate unchanged at 0.3%
The National Multifamily Report by Yardi Matrix highlights the highs and lows of the multifamily market in 2023. Despite strong demand, rent growth remained unchanged at 0.3 percent.

Self-Storage Facilities | Jan 5, 2024
The state of self-storage in early 2024
As the housing market cools down, storage facilities suffer from lower occupancy and falling rates, according to the December 2023 Yardi Matrix National Self Storage Report.

Designers | Dec 25, 2023
Redefining the workplace is a central theme in Gensler’s latest Design Report
The firm identifies eight mega trends that mostly stress human connections.

Contractors | Dec 12, 2023
The average U.S. contractor has 8.5 months worth of construction work in the pipeline, as of November 2023
Associated Builders and Contractors reported today that its Construction Backlog Indicator inched up to 8.5 months in November from 8.4 months in October, according to an ABC member survey conducted Nov. 20 to Dec. 4. The reading is down 0.7 months from November 2022.

Market Data | Nov 27, 2023
Number of employees returning to the office varies significantly by city
While the return-to-the-office trend is felt across the country, the percentage of employees moving back to their offices varies significantly according to geography, according to Eptura’s Q3 Workplace Index.

Market Data | Nov 14, 2023
The average U.S. contractor has 8.4 months worth of construction work in the pipeline, as of September 2023
Associated Builders and Contractors reported that its Construction Backlog Indicator declined to 8.4 months in October from 9.0 months in September, according to an ABC member survey conducted from Oct. 19 to Nov. 2. The reading is down 0.4 months from October 2022. Backlog now stands at its lowest level since the first quarter of 2022.

Multifamily Housing | Nov 9, 2023
Multifamily project completions forecast to slow starting 2026
Yardi Matrix has released its Q4 2023 Multifamily Supply Forecast, emphasizing a short-term spike and plateau of new construction.

Contractors | Nov 1, 2023
Nonresidential construction spending increases for the 16th straight month, in September 2023
National nonresidential construction spending increased 0.3% in September, according to an Associated Builders and Contractors analysis of data published today by the U.S. Census Bureau. On a seasonally adjusted annualized basis, nonresidential spending totaled $1.1 trillion.

Market Data | Oct 23, 2023
New data finds that the majority of renters are cost-burdened
The most recent data derived from the 2022 Census American Community Survey reveals that the proportion of American renters facing housing cost burdens has reached its highest point since 2012, undoing the progress made in the ten years leading up to the pandemic.


