


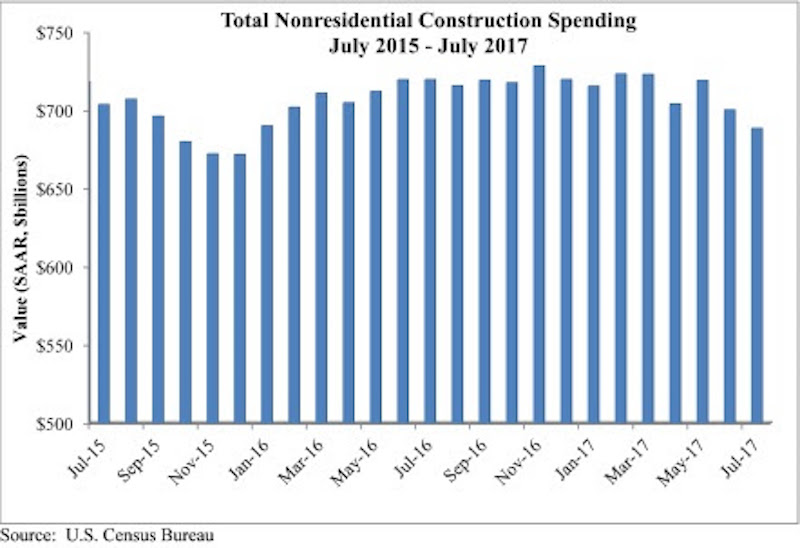
Nonresidential construction spending fell 1.7% in July, totaling $688.4 billion on a seasonally adjusted, annualized basis, according to an analysis by Associated Builders and Contractors (ABC) of data recently released by the U.S. Census Bureau. The absolute level of nonresidential construction spending was at its lowest point since December 2015.
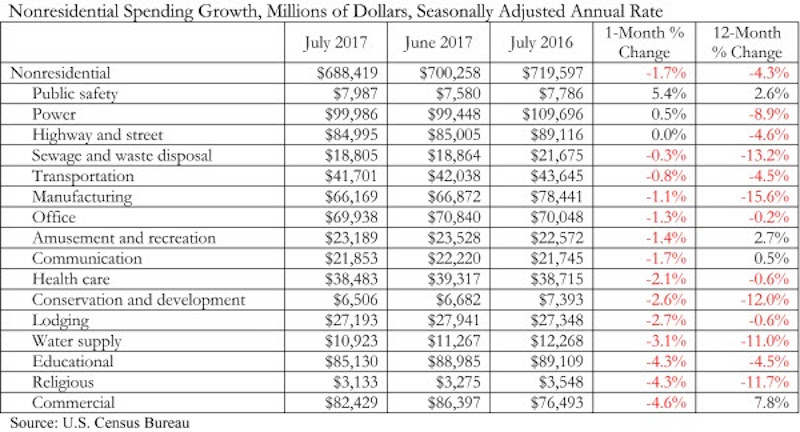
Weakness in spending was widespread. 13 of the 16 nonresidential subsectors contracted for the month. Only the public safety and power categories experienced monthly increases, while the highway and street category remained unchanged for the month. However, May and June nonresidential spending was revised upward by a collective $11 billion.
“As a society, we collect and report data in order to clarify the nature of our circumstances and how they are changing,” said ABC Chief Economist Anirban Basu. “However, recently received data have muddied, not clarified, our collective understanding of how well the nation’s nonresidential construction sector is performing.
 Courtesy ABC.
“Earlier today, we received information indicating that hiring among nonresidential construction firms was brisk in August,” said Basu. “Job growth was significant among nonresidential construction specialty trade contractors and heavy and civil engineering firms, among others. Interpreted independently, this would suggest growing activity in private and public segments.
“But today’s construction spending report points in precisely the opposite direction. Based on that data, nonresidential construction activity has been trending lower since early 2017,” said Basu. “A number of private segments that had been generating significant growth in opportunities for contractors saw activity dwindle in July, including office (-1.3%), lodging (-2.7%), and amusement and recreation (-1.4%). For economists and other stakeholders, the question now is whether today’s jobs report tells the tale or today’s spending data are a better indicator.
“Based on consideration of other factors, including leading indicators, the narrative suggesting that construction activity continues to rise seems more reasonable,” said Basu. “Anecdotally and in survey data, many nonresidential construction firms continue to report healthy backlog and are looking forward to an active 2018. Moreover, recent events in Texas and Louisiana imply that negative trends in nonresidential construction spending will be reversed as rebuilding commences.”
 Courtesy ABC.
Related Stories
Market Data | Jan 5, 2021
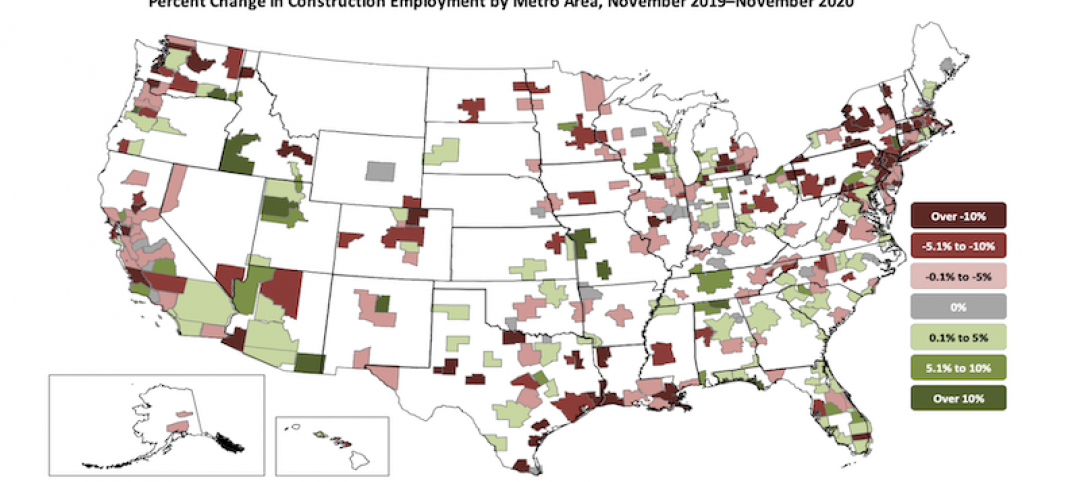
Barely one-third of metros add construction jobs in latest 12 months
Dwindling list of project starts forces contractors to lay off workers.

Market Data | Jan 4, 2021
Nonresidential construction spending shrinks further in November
Many commercial projects languish, even while homebuilding soars.
Market Data | Dec 29, 2020
Multifamily transactions drop sharply in 2020, according to special report from Yardi Matrix
Sales completions at end of Q3 were down over 41 percent from the same period a year ago.

Market Data | Dec 28, 2020
New coronavirus recovery measure will provide some needed relief for contractors coping with project cancellations, falling demand
Measure’s modest amount of funding for infrastructure projects and clarification that PPP loans may not be taxed will help offset some of the challenges facing the construction industry.

Market Data | Dec 28, 2020
Construction employment trails pre-pandemic levels in 35 states despite gains in industry jobs from October to November in 31 states
New York and Vermont record worst February-November losses, Virginia has largest pickup.

Market Data | Dec 16, 2020
Architecture billings lose ground in November
The pace of decline during November accelerated from October, posting an Architecture Billings Index (ABI) score of 46.3 from 47.5.

AEC Tech | Dec 8, 2020
COVID-19 affects the industry’s adoption of ConTech in different ways
A new JLL report assesses which tech options got a pandemic “boost.”
Market Data | Dec 7, 2020
Construction sector adds 27,000 jobs in November
Project cancellations, looming PPP tax bill will undercut future job gains.

Market Data | Dec 3, 2020
Only 30% of metro areas add construction jobs in latest 12 months
Widespread project postponements and cancellations force layoffs.

Market Data | Dec 2, 2020
New Passive House standards offers prescriptive path that reduces costs
Eliminates requirement for a Passive House consultant and attendant modeling.


