


The value of nonresidential building starts slightly fell in 2015, and was particularly soft in the latter months of the year, according to CMD Research Group.
The total value for nonresidential building stood at $186.307 billion in 2015, down 3.3% from 2014. Starts in December 2015 were 9.4% lower than the same month a year ago, and 7.3% lower than November 2015.
When heavy engineering, such as airport and highway construction, is thrown into the mix, the total value of nonresidential construction starts rose 1.9% to $309.221 billion. But heavy engineering, too, was softer in November and December.
The Industrial sector took the biggest hit last year, as manufacturing-related construction starts fell in value by 32.8% to $12.769 billion. Analysts have posited that manufacturing in the U.S. is suffering, in part, from the steady downturn in China’s economic growth.
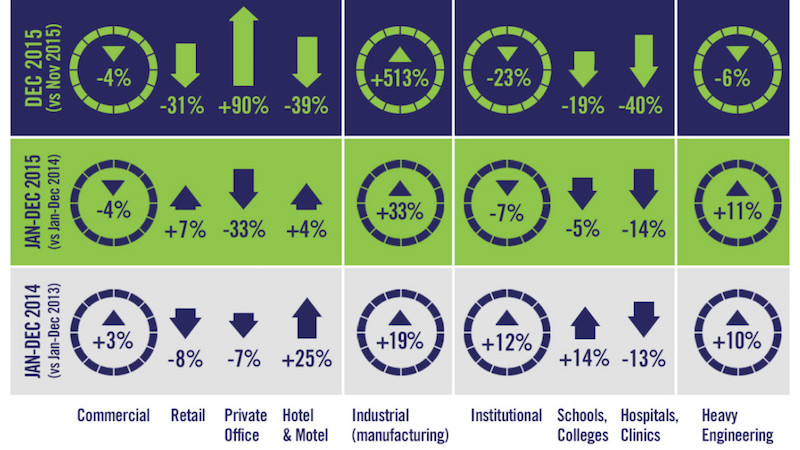 The last few months of 2015 were unkind to builders and developers, and pulled down the value of nonresidential construction starts, which ended the year up 1.9%. Nonresidential building starts were off 3.3%. Image courtesy of CMD Research Group.
Commercial construction was on shaky ground, too, as five of the 10 sectors that CMD tracks were negative. Private office building starts were down 32.6% to $11.828 billion, and the “amusement” category fell by 20.4% to $5.413 billion. On a positive note, Alex Carrick CMD’s chief economist, notes that commercial starts were buoyed by retail, which was down by 30.6% in December 2015 vs. December 2015, but still managed to show a positive full-year gain of 7.3% to $18.952 billion.
The wildest swing occurred in the warehouse sector, which cratered by 55.2% in December to December, but nonetheless finished full-year 2015 up 42.7% increase to $10.524 billion.
Schools and colleges accounted for 60% of the Institutional sector’s total starts. However, the category was off 18.7% in December compared to the same month in 2014, and down 4.5% for the full year, to $52.382 billion. The biggest institutional gainer was the police/prison/courthouse category, up 46.3% for the year to $5.664 billion.
CMD also provided a list of the 10 largest projects under construction in the U.S., led by the 40-story, $221 million mixed-use Milennium Tower in Boston. That’s followed by the 69-story commercial building at 401 9th Avenue in New York, whose start value CMD estimates at $317 million.
Related Stories

Hotel Facilities | Jul 27, 2023
U.S. hotel construction pipeline remains steady with 5,572 projects in the works
The hotel construction pipeline grew incrementally in Q2 2023 as developers and franchise companies push through short-term challenges while envisioning long-term prospects, according to Lodging Econometrics.

Hotel Facilities | Jul 26, 2023
Hospitality building construction costs for 2023
Data from Gordian breaks down the average cost per square foot for 15-story hotels, restaurants, fast food restaurants, and movie theaters across 10 U.S. cities: Boston, Chicago, Las Vegas, Los Angeles, Miami, New Orleans, New York, Phoenix, Seattle, and Washington, D.C.

Market Data | Jul 24, 2023
Leading economists call for 2% increase in building construction spending in 2024
Following a 19.7% surge in spending for commercial, institutional, and industrial buildings in 2023, leading construction industry economists expect spending growth to come back to earth in 2024, according to the July 2023 AIA Consensus Construction Forecast Panel.

Contractors | Jul 13, 2023
Construction input prices remain unchanged in June, inflation slowing
Construction input prices remained unchanged in June compared to the previous month, according to an Associated Builders and Contractors analysis of U.S. Bureau of Labor Statistics Producer Price Index data released today. Nonresidential construction input prices were also unchanged for the month.

Contractors | Jul 11, 2023
The average U.S. contractor has 8.9 months worth of construction work in the pipeline, as of June 2023
Associated Builders and Contractors reported that its Construction Backlog Indicator remained unchanged at 8.9 months in June 2023, according to an ABC member survey conducted June 20 to July 5. The reading is unchanged from June 2022.

Market Data | Jul 5, 2023
Nonresidential construction spending decreased in May, its first drop in nearly a year
National nonresidential construction spending decreased 0.2% in May, according to an Associated Builders and Contractors analysis of data published today by the U.S. Census Bureau. On a seasonally adjusted annualized basis, nonresidential spending totaled $1.06 trillion.

Apartments | Jun 27, 2023
Average U.S. apartment rent reached all-time high in May, at $1,716
Multifamily rents continued to increase through the first half of 2023, despite challenges for the sector and continuing economic uncertainty. But job growth has remained robust and new households keep forming, creating apartment demand and ongoing rent growth. The average U.S. apartment rent reached an all-time high of $1,716 in May.

Industry Research | Jun 15, 2023
Exurbs and emerging suburbs having fastest population growth, says Cushman & Wakefield
Recently released county and metro-level population growth data by the U.S. Census Bureau shows that the fastest growing areas are found in exurbs and emerging suburbs.

Contractors | Jun 13, 2023
The average U.S. contractor has 8.9 months worth of construction work in the pipeline, as of May 2023
Associated Builders and Contractors reported that its Construction Backlog Indicator remained unchanged at 8.9 months in May, according to an ABC member survey conducted May 20 to June 7. The reading is 0.1 months lower than in May 2022. Backlog in the infrastructure category ticked up again and has now returned to May 2022 levels. On a regional basis, backlog increased in every region but the Northeast.

Industry Research | Jun 13, 2023
Two new surveys track how the construction industry, in the U.S. and globally, is navigating market disruption and volatility
The surveys, conducted by XYZ Reality and KPMG International, found greater willingness to embrace technology, workplace diversity, and ESG precepts.


