


The value of nonresidential building starts slightly fell in 2015, and was particularly soft in the latter months of the year, according to CMD Research Group.
The total value for nonresidential building stood at $186.307 billion in 2015, down 3.3% from 2014. Starts in December 2015 were 9.4% lower than the same month a year ago, and 7.3% lower than November 2015.
When heavy engineering, such as airport and highway construction, is thrown into the mix, the total value of nonresidential construction starts rose 1.9% to $309.221 billion. But heavy engineering, too, was softer in November and December.
The Industrial sector took the biggest hit last year, as manufacturing-related construction starts fell in value by 32.8% to $12.769 billion. Analysts have posited that manufacturing in the U.S. is suffering, in part, from the steady downturn in China’s economic growth.
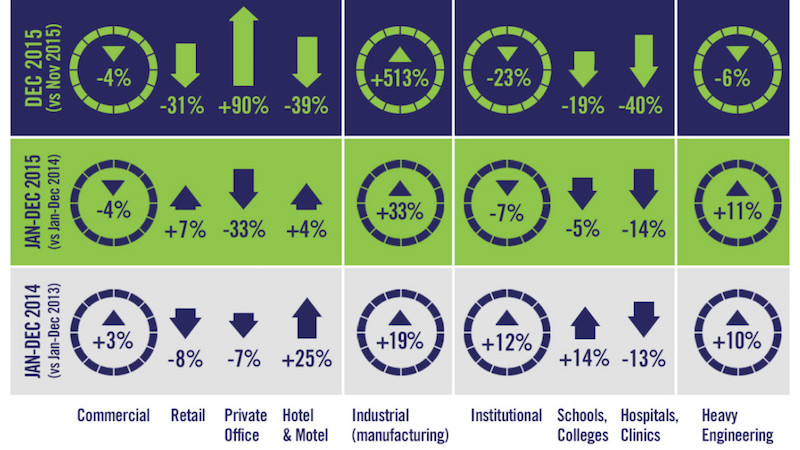 The last few months of 2015 were unkind to builders and developers, and pulled down the value of nonresidential construction starts, which ended the year up 1.9%. Nonresidential building starts were off 3.3%. Image courtesy of CMD Research Group.
Commercial construction was on shaky ground, too, as five of the 10 sectors that CMD tracks were negative. Private office building starts were down 32.6% to $11.828 billion, and the “amusement” category fell by 20.4% to $5.413 billion. On a positive note, Alex Carrick CMD’s chief economist, notes that commercial starts were buoyed by retail, which was down by 30.6% in December 2015 vs. December 2015, but still managed to show a positive full-year gain of 7.3% to $18.952 billion.
The wildest swing occurred in the warehouse sector, which cratered by 55.2% in December to December, but nonetheless finished full-year 2015 up 42.7% increase to $10.524 billion.
Schools and colleges accounted for 60% of the Institutional sector’s total starts. However, the category was off 18.7% in December compared to the same month in 2014, and down 4.5% for the full year, to $52.382 billion. The biggest institutional gainer was the police/prison/courthouse category, up 46.3% for the year to $5.664 billion.
CMD also provided a list of the 10 largest projects under construction in the U.S., led by the 40-story, $221 million mixed-use Milennium Tower in Boston. That’s followed by the 69-story commercial building at 401 9th Avenue in New York, whose start value CMD estimates at $317 million.
Related Stories

Hotel Facilities | Jan 22, 2024
U.S. hotel construction is booming, with a record-high 5,964 projects in the pipeline
The hotel construction pipeline hit record project counts at Q4, with the addition of 260 projects and 21,287 rooms over last quarter, according to Lodging Econometrics.

Multifamily Housing | Jan 15, 2024
Multifamily rent growth rate unchanged at 0.3%
The National Multifamily Report by Yardi Matrix highlights the highs and lows of the multifamily market in 2023. Despite strong demand, rent growth remained unchanged at 0.3 percent.

Self-Storage Facilities | Jan 5, 2024
The state of self-storage in early 2024
As the housing market cools down, storage facilities suffer from lower occupancy and falling rates, according to the December 2023 Yardi Matrix National Self Storage Report.

Designers | Dec 25, 2023
Redefining the workplace is a central theme in Gensler’s latest Design Report
The firm identifies eight mega trends that mostly stress human connections.

Contractors | Dec 12, 2023
The average U.S. contractor has 8.5 months worth of construction work in the pipeline, as of November 2023
Associated Builders and Contractors reported today that its Construction Backlog Indicator inched up to 8.5 months in November from 8.4 months in October, according to an ABC member survey conducted Nov. 20 to Dec. 4. The reading is down 0.7 months from November 2022.

Market Data | Nov 27, 2023
Number of employees returning to the office varies significantly by city
While the return-to-the-office trend is felt across the country, the percentage of employees moving back to their offices varies significantly according to geography, according to Eptura’s Q3 Workplace Index.

Market Data | Nov 14, 2023
The average U.S. contractor has 8.4 months worth of construction work in the pipeline, as of September 2023
Associated Builders and Contractors reported that its Construction Backlog Indicator declined to 8.4 months in October from 9.0 months in September, according to an ABC member survey conducted from Oct. 19 to Nov. 2. The reading is down 0.4 months from October 2022. Backlog now stands at its lowest level since the first quarter of 2022.

Multifamily Housing | Nov 9, 2023
Multifamily project completions forecast to slow starting 2026
Yardi Matrix has released its Q4 2023 Multifamily Supply Forecast, emphasizing a short-term spike and plateau of new construction.

Contractors | Nov 1, 2023
Nonresidential construction spending increases for the 16th straight month, in September 2023
National nonresidential construction spending increased 0.3% in September, according to an Associated Builders and Contractors analysis of data published today by the U.S. Census Bureau. On a seasonally adjusted annualized basis, nonresidential spending totaled $1.1 trillion.

Market Data | Oct 23, 2023
New data finds that the majority of renters are cost-burdened
The most recent data derived from the 2022 Census American Community Survey reveals that the proportion of American renters facing housing cost burdens has reached its highest point since 2012, undoing the progress made in the ten years leading up to the pandemic.


