

After dipping in the previous two quarters to levels unseen in nearly a decade, the Multifamily-for-Rent outlook for design and construction firms returned to pre-COVID levels in the 3rd Quarter, according to the PSMJ Resources’ Quarterly Market Forecast (QMF). The market’s net plus/minus index (NPMI) reached 40% for the 3rd Quarter, following quarters of -2% and +7%, respectively, in the first half of 2020. The negative index in the 1st Quarter was the first for the Multifamily market since 2010.
"The entire Housing market is showing impressive growth potential based on A/E proposal activity,” said PSMJ Senior Principal David Burstein, PE, AECPM. “This view is reinforced by government statistics for housing permits and new home starts. Multifamily housing (apartment buildings) took a brief pause from its 10-year growth surge when the COVID-19 crisis first hit in March, but has since recovered quite nicely. The condominium market actually saw a significant dip this spring, but more recently is showing signs of recovery, albeit not to the same levels as Multifamily-for-Rent.”
PSMJ’s NPMI expresses the difference between the percentage of firms reporting an increase in proposal activity and those reporting a decrease. The QMF has proven to be a solid predictor of market health for the architecture and engineering (A/E) industry since its inception in 2003. A consistent group of over 300 A/E firm leaders participate regularly, with 162 contributing to the most recent survey.
Multifamily-for-Rent Market Proposal Activity – 1Q08 to 3Q20 (NPMI)
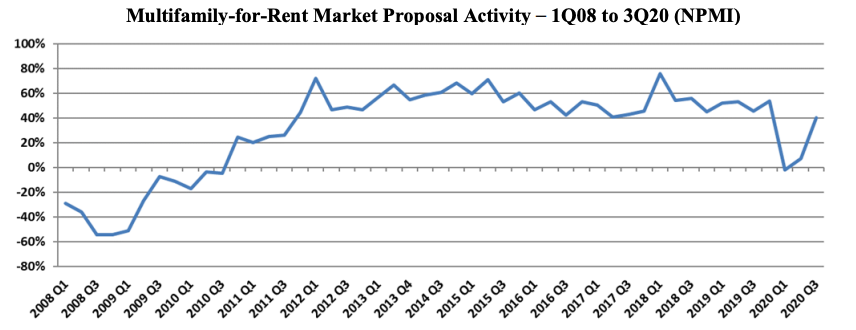
The Multifamily market returned to positive territory out of the Great Recession in the 4th Quarter of 2010 with an NPMI of 24%, then jumped to 44% in the 4th Quarter of 2011. It never dropped below 41% again until it plummeted from 54% in the 4th Quarter of 2019 to -2% in the 1st Quarter of 2020.
“Many of the factors that drove Multifamily's growth pre-COVID remain in place,” adds Burstein. “Plus, there is now a new factor – the potential flight of many people from cities to suburbs – which is shifting the location of the demand. So we believe the Multifamily market will continue to be strong into the foreseeable future.”
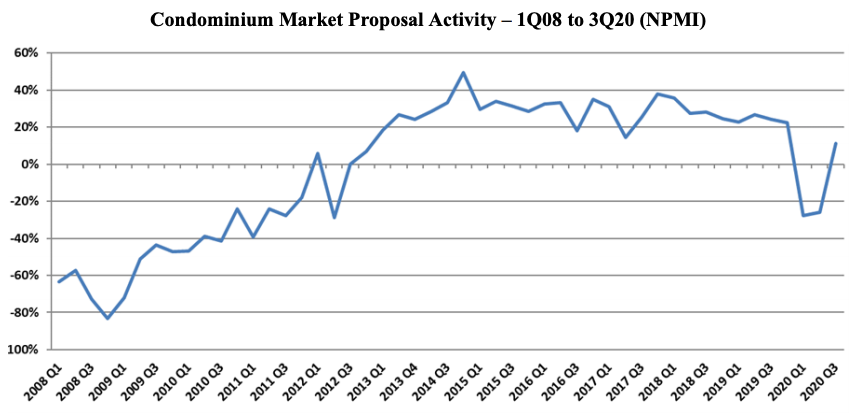
Condominium proposal activity soared to a positive NPMI of 11% in the 3rd Quarter, up from -26% in the 2nd Quarter. The Condo market took longer to recover from the last recession than Multifamily-for-Rent did, not rebounding to positive numbers until late 2012. Its NPMI generally stayed in the 20% and 30% range for the next seven years running, until plummeting from 22% in the 4th Quarter of 2019 to a nine-year low of -28% in the 1st Quarter of 2020.
Condominium Market Proposal Activity – 1Q08 to 3Q20 (NPMI)
The Multifamily rebound was part of overall improving conditions for the Housing market, which paced all 12 of the major markets assessed in the QMF with an overall NPMI of 38%. Among other Housing submarkets, Single-Family Property (individual houses) also recorded a 40% NPMI (up from 9%), with Single-Family Development (Subdivisions) at 27%, up from -12%, and Senior & Assisted Living (Independent Living) at 26%, up from -1%,.
Among the 12 major markets surveyed, Water/Wastewater was a close second to Housing at 37%, followed by Healthcare (30%), Energy/Utilities (28%) and Light Industry (27%). Overall proposal activity across all markets and submarkets returned to growth mode in the 3rd Quarter with an NPMI of 22%, up from -10% in the 2nd Quarter. The three worst-performing major markets in the 3rd Quarter were Education (-36%), Commercial Users (-31%) and Commercial Developers (-21%).
PSMJ Resources, a consulting and publishing company dedicated to the A/E industry, has conducted its Quarterly Market Forecast for more than 17 years. It includes data on 12 major markets and 58 submarkets served by A/E firms. For more information, go to https://www.psmj.com/surveys/quarterly-market-forecast-2.
Related Stories

Market Data | Nov 30, 2016
Marcum Commercial Construction Index reports industry outlook has shifted; more change expected
Overall nonresidential construction spending in September totaled $690.5 billion, down a slight 0.7 percent from a year earlier.

Industry Research | Nov 30, 2016
Multifamily millennials: Here is what millennial renters want in 2017
It’s all about technology and convenience when it comes to the things millennial renters value most in a multifamily facility.
Market Data | Nov 29, 2016
It’s not just traditional infrastructure that requires investment
A national survey finds strong support for essential community buildings.

Industry Research | Nov 28, 2016
Building America: The Merit Shop Scorecard
ABC releases state rankings on policies affecting construction industry.

Multifamily Housing | Nov 28, 2016
Axiometrics predicts apartment deliveries will peak by mid 2017
New York is projected to lead the nation next year, thanks to construction delays in 2016

Market Data | Nov 22, 2016
Construction activity will slow next year: JLL
Risk, labor, and technology are impacting what gets built.

Market Data | Nov 17, 2016
Architecture Billings Index rebounds after two down months
Decline in new design contracts suggests volatility in design activity to persist.

Market Data | Nov 11, 2016
Brand marketing: Why the B2B world needs to embrace consumers
The relevance of brand recognition has always been debatable in the B2B universe. With notable exceptions like BASF, few manufacturers or industry groups see value in generating top-of-mind awareness for their products and services with consumers.

Industry Research | Nov 8, 2016
Austin, Texas wins ‘Top City’ in the Emerging Trends in Real Estate outlook
Austin was followed on the list by Dallas/Fort Worth, Texas and Portland, Ore.

Market Data | Nov 2, 2016
Nonresidential construction spending down in September, but August data upwardly revised
The government revised the August nonresidential construction spending estimate from $686.6 billion to $696.6 billion.


