


Grumman/Butkus Associates, a firm of energy efficiency consultants and sustainable design engineers, recently released the results of its 2019 Hospital Energy and Water Benchmarking Survey, focusing on healthcare facilities’ resource usage trends and costs for calendar year 2018.
Since G/BA initiated the survey more than 20 years ago, hospitals’ overall fossil fuel use has trended downward, but electricity use isn’t declining as much. The average combined Btu/ft2 (electricity plus gas/steam) for participating facilities was 245,258 in this year’s survey, up from 241,733 in CY2017.
Square-foot prices for gas/steam fell modestly ($0.74 in 2918, compared with $0.75 in 2017), but square-foot prices for electricity climbed rose sharply ($2.57 in 2018, compared with $2.41 in 2017). The overall result is that hospitals’ total ft2 costs for energy (gas/steam plus electric) increased: $3.31 for 2018, compared with $3.16 for 2017.
Hospitals’ average carbon footprint has remained fairly steady at 50 to 60 pounds of CO2 equivalent per ft2 per year since G/BA began calculating carbon data in 1999. “If we are going to address the very daunting issue of climate change, the healthcare industry must make greater strides in reducing its carbon footprint,” says Dan Doyle, G/BA Chairman. “As the trend data shows, not enough progress is being made so far.”
Participating facilities displayed a broad range of usage patterns. For instance, some participants are using more than 250,000 BTU/ft2 in fossil fuel annually, compared with a general mid-range of facilities (about 140,000 BTU/ft2/year) and those that used least (75,000 BTU/ft2/year or less). Similarly, a few hospitals consume more than 45 kWh/ft2/year in electricity, compared with a mid-range of about 30 kWh/ft2/year. A few squeaked by with less than 18 kWh/ft2/year.
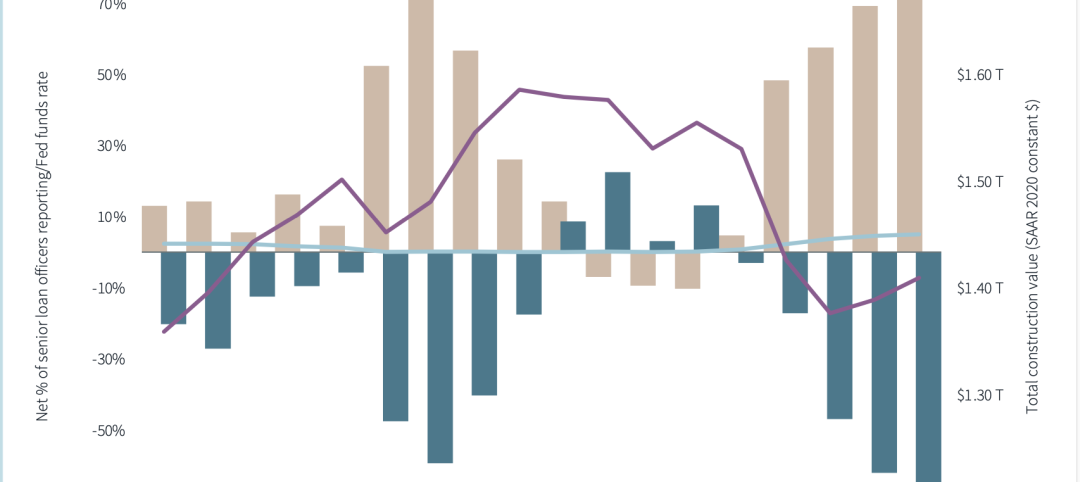
 Hospitals’ energy costs per square foot (red boxes) rose in 2018. Energy use intensity (Btu/sf/year, blue bars) has drifted downward over time but also ticked up in 2018. Chart ©2020 Grumman/Butkus Associates.
“Facilities that have high unit costs for energy should view this as an opportunity,” says Doyle. “For example, an energy conservation project that would have a five-year payback at an ‘average’ facility may have a payback of just 2.5 or 3 years at a facility with higher unit costs for energy.”
Hospital water/sewer use is also gradually declining, currently averaging about 48 gallons per square foot per year (compared with more than 60 gallons/ ft2/year a decade ago). Costs for water/sewer are generally rising, however, now averaging $0.44 /ft2. “G/BA expects the trend of rising water and sewer costs to continue,” says Doyle. “Price hikes not only reflect increasing costs to extract and treat the water, but also the fact that cash-strapped governmental entities may view water as a revenue source. Costs to upgrade or replace aging infrastructure are also contributing to escalating costs”
Since 1995, the G/BA survey has provided a free annual benchmarking resource. Hospitals are invited to participate by submitting responses to a short list of questions. Information for this edition was provided by 125 hospitals located in Illinois (48), Wisconsin (18), Indiana (16), Michigan (15), Texas (13), and several other states.
Full results and analysis, as well as information about participating in the 2020 survey (2019 data), are available at the firm’s website: grummanbutkus.com/HES. For additional information, contact Dan Doyle (ddoyle@grummanbutkus.com) or Julie Higginbotham (jhigginbotham@grummanbutkus.
Related Stories

Contractors | Nov 1, 2023
Nonresidential construction spending increases for the 16th straight month, in September 2023
National nonresidential construction spending increased 0.3% in September, according to an Associated Builders and Contractors analysis of data published today by the U.S. Census Bureau. On a seasonally adjusted annualized basis, nonresidential spending totaled $1.1 trillion.

Market Data | Oct 23, 2023
New data finds that the majority of renters are cost-burdened
The most recent data derived from the 2022 Census American Community Survey reveals that the proportion of American renters facing housing cost burdens has reached its highest point since 2012, undoing the progress made in the ten years leading up to the pandemic.

Contractors | Oct 19, 2023
Crane Index indicates slowing private-sector construction
Private-sector construction in major North American cities is slowing, according to the latest RLB Crane Index. The number of tower cranes in use declined 10% since the first quarter of 2023. The index, compiled by consulting firm Rider Levett Bucknall (RLB), found that only two of 14 cities—Boston and Toronto—saw increased crane counts.

Market Data | Oct 2, 2023
Nonresidential construction spending rises 0.4% in August 2023, led by manufacturing and public works sectors
National nonresidential construction spending increased 0.4% in August, according to an Associated Builders and Contractors analysis of data published today by the U.S. Census Bureau. On a seasonally adjusted annualized basis, nonresidential spending totaled $1.09 trillion.

Giants 400 | Sep 28, 2023
Top 100 University Building Construction Firms for 2023
Turner Construction, Whiting-Turner Contracting Co., STO Building Group, Suffolk Construction, and Skanska USA top BD+C's ranking of the nation's largest university sector contractors and construction management firms for 2023, as reported in Building Design+Construction's 2023 Giants 400 Report. Note: This ranking includes revenue for all university/college-related buildings except student residence halls, sports/recreation facilities, laboratories, S+T-related buildings, parking facilities, and performing arts centers (revenue for those buildings are reported in their respective Giants 400 ranking).

Construction Costs | Sep 28, 2023
U.S. construction market moves toward building material price stabilization
The newly released Quarterly Construction Cost Insights Report for Q3 2023 from Gordian reveals material costs remain high compared to prior years, but there is a move towards price stabilization for building and construction materials after years of significant fluctuations. In this report, top industry experts from Gordian, as well as from Gilbane, McCarthy Building Companies, and DPR Construction weigh in on the overall trends seen for construction material costs, and offer innovative solutions to navigate this terrain.

Data Centers | Sep 21, 2023
North American data center construction rises 25% to record high in first half of 2023, driven by growth of artificial intelligence
CBRE’s latest North American Data Center Trends Report found there is 2,287.6 megawatts (MW) of data center supply currently under construction in primary markets, reaching a new all-time high with more than 70% already preleased.

Contractors | Sep 12, 2023
The average U.S. contractor has 9.2 months worth of construction work in the pipeline, as of August 2023
Associated Builders and Contractors' Construction Backlog Indicator declined to 9.2 months in August, down 0.1 month, according to an ABC member survey conducted from Aug. 21 to Sept. 6. The reading is 0.5 months above the August 2022 level.

Contractors | Sep 11, 2023
Construction industry skills shortage is contributing to project delays
Relatively few candidates looking for work in the construction industry have the necessary skills to do the job well, according to a survey of construction industry managers by the Associated General Contractors of America (AGC) and Autodesk.
Market Data | Sep 6, 2023
Far slower construction activity forecast in JLL’s Midyear update
The good news is that market data indicate total construction costs are leveling off.


