


Lodging Econometrics (LE) has released its year-end Global Construction Pipeline Trend Report, which compiles the construction pipeline counts for every country and market around the world. At the close of 2018, LE analysts state that the total global construction pipeline hit record highs with 13,573 projects/2,265,792 rooms, a 7% increase in projects and a 6% increase in rooms year-over-year (YOY).
The global pipeline has been ascending for eight consecutive years after reaching its cyclical low in 2010. All regional pipelines, with the exception of South America, continued their upward trend YOY. It is notable considering economic growth rates started to decline in 2018 and are forecast to slow further in 2019 and 2020. Four of the seven global regions reached all-time highs in 2018: Europe, Africa, Middle East, and Asia Pacific.
There are a record high 6,352 projects/1,172,591 rooms currently under construction worldwide. Projects scheduled to start construction in the next 12 months are at 3,860 projects/572,483 rooms. Projects in the early planning stage stand at 3,361rooms/520,718 projects, also at an all-time high.
The top countries by project count are the United States with 5,530 projects/669,456 rooms, still short of its all-time high of 5,883 projects/785,547 rooms set in the second quarter of 2008, and China with 2,761 projects/580,635 rooms whose pipeline reached a new all-time high. The U.S. accounts for 41% of projects in the total global construction pipeline while China accounts for 20%, resulting in 61% of all global projects being focused in just these two countries. Distantly following are Indonesia with 387 projects/65,405 rooms, Germany with 283 projects/52,569 rooms, and the United Kingdom with 266 projects/38,590 rooms.
Around the world, the cities with the largest pipeline counts are New York City with 171 projects/29,457 rooms, Dubai with 168 projects/49,943 rooms, and Dallas with 163 projects/19,476 rooms. Los Angeles follows with 147 projects/23,404 rooms, and Guangzhou, China with 132 projects/28,694 rooms.
The leading franchise companies in the global construction pipeline by project count are Marriott International with 2,544 projects/420,405 rooms, Hilton Worldwide with 2,252 projects/333,209 rooms, InterContinental Hotels Group (IHG) with 1,716 projects/249,379 rooms, and AccorHotels with 966 projects/177,052 rooms. These four companies account for 55% of all projects in the global pipeline.
Brands leading in the pipeline for each of these companies are Marriott’s Fairfield Inn with 397 projects/43,089 rooms, Hampton by Hilton with 619 projects/79,591 rooms, IHG’s Holiday Inn Express with 731 projects/91,691 rooms, and AccorHotel’s Ibis Brands with 321 projects/48,368 rooms.
Related Stories

Market Data | Sep 22, 2016
Architecture Billings Index slips, overall outlook remains positive
Business conditions are slumping in the Northeast.
Market Data | Sep 20, 2016
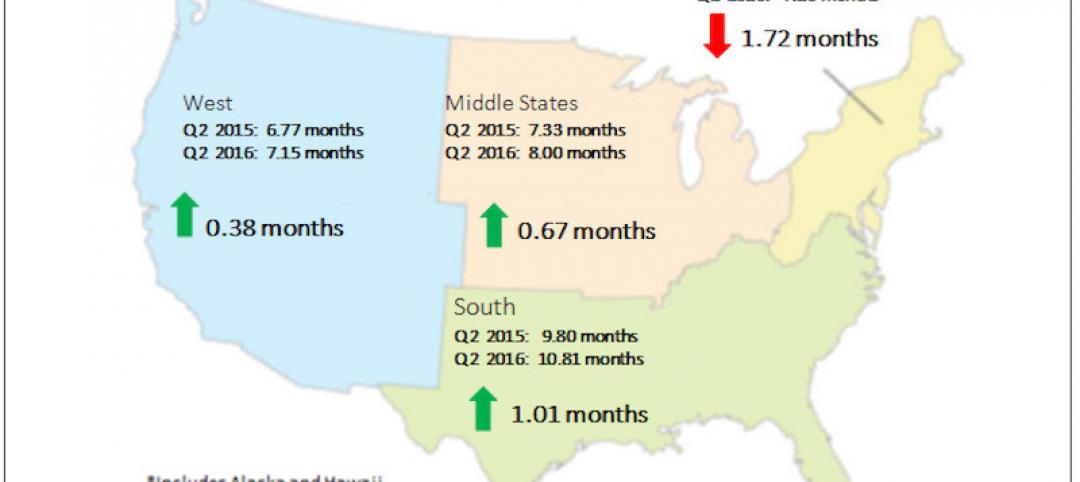
Backlog skyrockets for largest firms during second quarter, but falls to 8.5 months overall
While a handful of commercial construction segments continue to be associated with expanding volumes, for the most part, the average contractor is no longer getting busier, says ABC Chief Economist Anirban Basu.
Designers | Sep 13, 2016
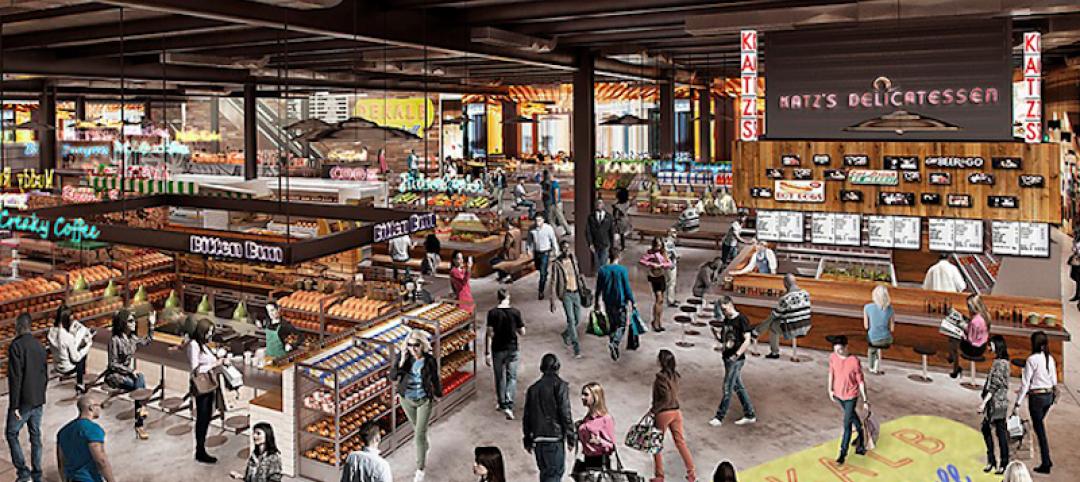
5 trends propelling a new era of food halls
Food halls have not only become an economical solution for restauranteurs and chefs experiencing skyrocketing retail prices and rents in large cities, but they also tap into our increased interest in gourmet locally sourced food, writes Gensler's Toshi Kasai.

Building Team | Sep 6, 2016
Letting your resource take center stage: A guide to thoughtful site selection for interpretive centers
Thoughtful site selection is never about one factor, but rather a confluence of several components that ultimately present trade-offs for the owner.
Market Data | Sep 2, 2016
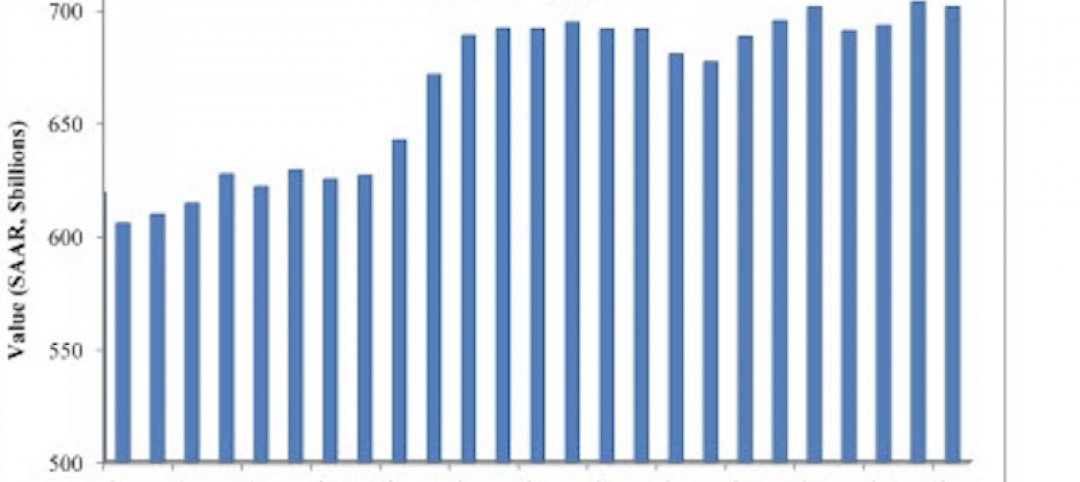
Nonresidential spending inches lower in July while June data is upwardly revised to eight-year record
Nonresidential construction spending has been suppressed over the last year or so with the primary factor being the lack of momentum in public spending.

Industry Research | Sep 1, 2016
CannonDesign releases infographic to better help universities obtain more R&D funding
CannonDesign releases infographic to better help universities obtain more R&D funding.

Industry Research | Aug 25, 2016
Building bonds: The role of 'trusted advisor' is earned not acquired
A trusted advisor acts as a guiding partner over the full course of a professional relationship.

Multifamily Housing | Aug 17, 2016
A new research platform launches for a data-deprived multifamily sector
The list of leading developers, owners, and property managers that are funding the NMHC Research Foundation speaks to the information gap it hopes to fill.
Hotel Facilities | Aug 17, 2016
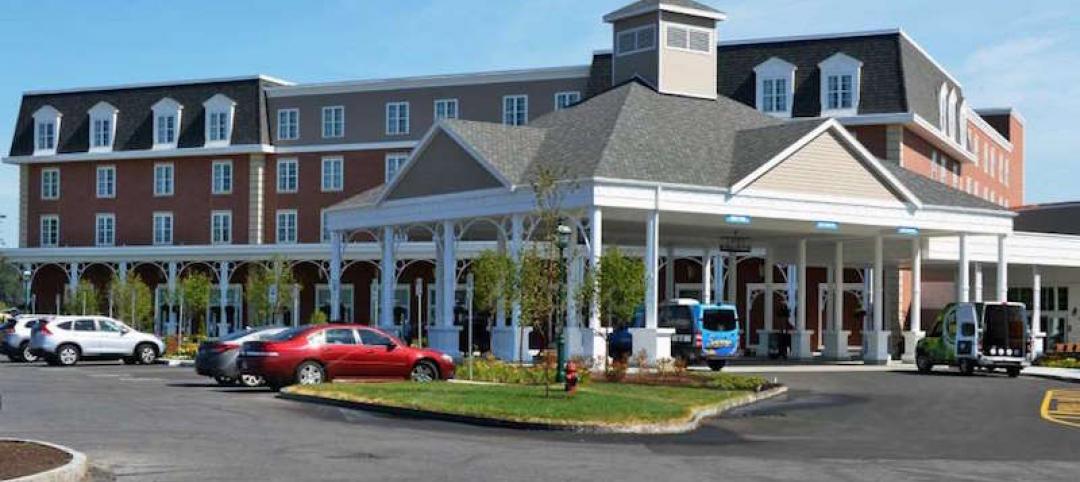
Hotel construction continues to flourish in major cities
But concerns about overbuilding persist.
Market Data | Aug 16, 2016
Leading economists predict construction industry growth through 2017
The Chief Economists for ABC, AIA, and NAHB all see the construction industry continuing to expand over the next year and a half.


