


A new report on office fit-out costs in North America sets out to establish a range of benchmarks for three different office styles, and to suggest what businesses favor which style.
JLL’s project and development services group, which produced the report, used data from more than 2,800 JLL-managed project budgets for over 100 clients from 17 industries in 59 markets throughout the U.S. and Canada.
The goal, says JLL, is to “elevate the conversation” around the real costs of building out various real estate designs. This year’s report includes office layout and space quality components to allow for evaluations of different office layouts, project complexities, and materials. It also provides high, medium, and low allowances for furniture, fixtures, and equipment (FFE); as well as for the installation of audio-visual and security equipment.
The result is an Office Fit Out Matrix, which shows how a handful of dynamics affect fit-out costs. Depending on the market and style, the costs range from $120.18 per sf to $216.07 per sf (see chart).
JLL breaks down these costs by region and metro market. The Northeast and Northwest consistently have higher fit-out costs. The medium costs in New York City are 28.5% above the U.S. average. In San Francisco, a fit-out would cost 22.6% more than the U.S. average. Conversely, the medium fit-out costs in West Palm Beach, Fla., are 15.9% below the national average; in Austin, Texas, 15.3% below.
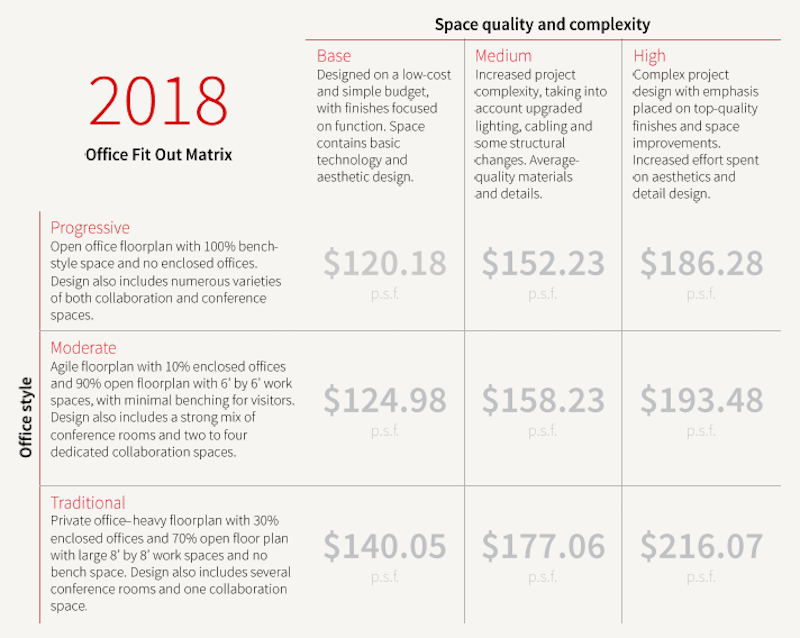
This office fit-out matrix is based on data from over 2,800 project budgets in North America that JLL managed. Image: JLL
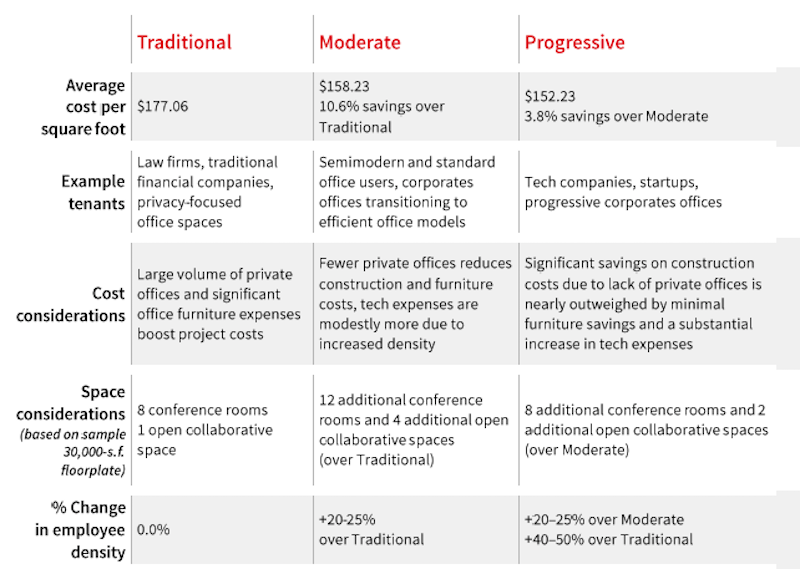
JLL's matrix compares the medium costs for fitting out three different office styles. Image: JLL
Three office styles examined
JLL divides its office fit-out costs along three styles:
• A Traditional office is still the most expensive to fit out. This style has the highest percentage of private office spaces, and typically between 20% and 50% fewer employees than the other two styles. Its FFE costs are the highest among the three styles, too. And tenant factors are “relatively small,” says JLL, because there is less common area. These offices are still favored by law firms, financial services companies, and businesses that focus on privacy with their offices.
JLL observes that some Traditional office styles are introducing lower-partition bench desks.
• A less-expensive fit-out, a Moderate office style features “agile” floorplans, with 10% dedicated to enclosed offices, and the rest of the space open with 6x6-foot workstations and minimal benching and guest space. Moderate offices—which are 20-25% less dense than Progressive office styles—include a healthy mix of conference rooms, and a few multipurpose and collaborative spaces. The hard fit-out costs for the Moderate style are average, but cost efficiencies can be captured by adding more bench-style desks.
• The Progressive office style is distinguished by an open floorplan, 100% of its desk space outfitted as bench-style furniture with zero enclosed spaces. This style’s focus is on activity-based working. Its employee density is 20-50% higher than a Traditional office, and it has double the amount of collaborative and conference spaces. (A standard plan would include 20 conference rooms and seven open collaborative/multi-use spaces.)
JLL points out that Progressive fit-outs generally have higher technology costs, but save money on FFE spending.
Landlords allowing for more upgrades
Last year, nearly 69 million sf of new office space were delivered to the market, but only 47.4% was preleased. JLL’s report observes that landlords are spending more to compete for tenants that are consistently gravitating toward high-quality spaces and assets. Consequently, landlords are offering better tenant improvement packages.
JLL cites several reasons for this trend, including the steady climb in construction costs, which increased on average by 15% last year. Landlords also offer better tenant improvement packages to offset the impact of higher rents.
The national average for tenant improvement allowances was $44 per sf, ranging from $105/sf in Washington D.C. to $28/sf in Nashville.
The report provides detailed snapshots of several markets, such as Austin, one of the country’s dynamic office markets, with robust growth supply. There are 3.1 million sf of new office space in Austin’s pipeline, 36% of which is preleased. The average tenant improvement allowance there last year was $45/sf.
There’s 7 million sf of new office space in the pipeline in San Francisco, where the office vacancy rate is 9.1%, and 68.8% of new space is preleased. The average tenant improvement allowance in San Francisco last year was $60/sf.
Related Stories
| Aug 11, 2010
CTBUH changes height criteria; Burj Dubai height increases, others decrease
The Council on Tall Buildings and Urban Habitat (CTBUH)—the international body that arbitrates on tall building height and determines the title of “The World’s Tallest Building”—has announced a change to its height criteria, as a reflection of recent developments with several super-tall buildings.
| Aug 11, 2010
BIG's 'folded façade' design takes first-prize in competition for China energy company headquarters
Copenhagen-based architect BIG, in collaboration with ARUP and Transsolar, was awarded first-prize in an international competition to design Shenzhen International Energy Mansion, the regional headquarters for the Shenzhen Energy Company.
| Aug 11, 2010
Jacobs, Arup, AECOM top BD+C's ranking of the nation's 75 largest international design firms
A ranking of the Top 75 International Design Firms based on Building Design+Construction's 2009 Giants 300 survey. For more Giants 300 rankings, visit http://www.BDCnetwork.com/Giants
| Aug 11, 2010
New air-conditioning design standard allows for increased air speed to cool building interiors
Building occupants, who may soon feel cooler from increased air movement, can thank a committee of building science specialists. The committee in charge of ANSI/ASHRAE Standard 55 - Thermal Environmental Conditions for Human Occupancy—after months of study and discussion--has voted recently to allow increased air speed as an option for cooling building interiors. In lay terms, increased air speed is the equivalent of turning up the fan.
| Aug 11, 2010
Architecture Billings Index flat in May, according to AIA
After a slight decline in April, the Architecture Billings Index was up a tenth of a point to 42.9 in May. As a leading economic indicator of construction activity, the ABI reflects the approximate nine to twelve month lag time between architecture billings and construction spending. Any score above 50 indicates an increase in billings.
| Aug 11, 2010
Free-span solar energy system installed at REM Eyewear headquarters
The first cable-suspended free-span solar energy system was completed today over the REM Eyewear headquarters parking lot in Sun Valley, Calif. The patented, cable-supported photovoltaic system created by P4P Energy is expected to generate 40,877 kilowatt-hours of renewable electricity per year, enough to power five to six single family homes and to prevent 1.5 million pounds of carbon from being released into the atmosphere.
| Aug 11, 2010
Construction employment declined in 333 of 352 metro areas in June
Construction employment declined in all but 19 communities nationwide this June as compared to June-2008, according to a new analysis of metropolitan-area employment data released today by the Associated General Contractors of America. The analysis shows that few places in America have been spared the widespread downturn in construction employment over the past year.
| Aug 11, 2010
Jacobs, Hensel Phelps among the nation's 50 largest design-build contractors
A ranking of the Top 50 Design-Build Contractors based on Building Design+Construction's 2009 Giants 300 survey. For more Giants 300 rankings, visit http://www.BDCnetwork.com/Giants


