

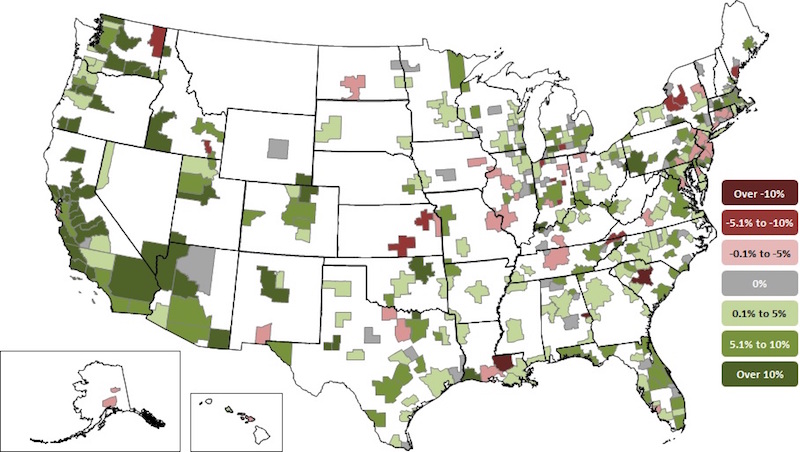
Construction employment increased in 257 out of 358 metro areas between February 2017 and February 2018, declined in 50 and stagnated in 51, according to a new analysis of federal employment data released today by the Associated General Contractors of America. Association officials said that the employment gains are occurring as construction firms in many parts of the country are having a hard time finding enough qualified workers to keep pace with demand.
"Growing private-sector demand for construction services is prompting construction firms to hire more people to complete projects," said Ken Simonson, the association's chief economist. "Yet tight labor markets, particularly for qualified construction workers, is making it increasingly difficult for firms to find people to bring on board."
Riverside-San Bernardino-Ontario, Calif. added the most construction jobs during the past year (12,000 jobs, 13%), followed by Phoenix-Mesa-Scottsdale, Ariz. (9,900 jobs, 9%); Dallas-Plano-Irving, Texas (9,700 jobs, 7%); Houston-The Woodlands-Sugar Land, Texas (9,300 jobs, 4%) and Los Angeles-Long Beach-Glendale, Calif. (7,700 jobs, 6%). The largest percentage gains occurred in the Merced, Calif. metro area (33%, 700 jobs) followed by Midland, Texas (22%, 5,400 jobs); Lake Charles, La. (21%, 4,700 jobs) and Weirton-Steubenville, W.V.-Ohio (21%, 300 jobs).
The largest job losses from February 2017 to February 2018 were in Baton Rouge, La. (-6,500 jobs, -12%), followed by St. Louis, Mo.-Ill. (-2,500 jobs, -4%); Columbia, S.C. (-2,200 jobs, -11%); Fort Worth-Arlington, Texas (-2,000 jobs, -3%) and Middlesex-Monmouth-Ocean, N.J. (-1,700 jobs, -5%). The largest percentage decreases for the year were in Auburn-Opelika, Ala. (-38%, -1,500 jobs) followed by Baton Rouge, Columbia, S.C. and Kokomo, Ind. (-9%, -100 jobs).
Association officials said that growing private sector demand in February is prompting many firms to add more staff as they work to complete projects. They added that the recently-enacted federal spending measure includes up to $10 billion in additional infrastructure funding for this year, meaning firms that perform public-sector work are likely to begin expanding as well amid tight labor market conditions.
"As demand for construction continues to expand, it will only get harder for many firms to find qualified workers to hire," said Stephen E. Sandherr, the association's chief executive officer. "Congress and the administration should work together to expand career and technical education opportunities so more high school students will opt for good-paying careers in construction."
View the metro employment data by rank and state. View metro employment map.
Related Stories

Contractors | Apr 19, 2023
Rising labor, material prices cost subcontractors $97 billion in unplanned expenses
Subcontractors continue to bear the brunt of rising input costs for materials and labor, according to a survey of nearly 900 commercial construction professionals.

Data Centers | Apr 14, 2023
JLL's data center outlook: Cloud computing, AI driving exponential growth for data center industry
According to JLL’s new Global Data Center Outlook, the mass adoption of cloud computing and artificial intelligence (AI) is driving exponential growth for the data center industry, with hyperscale and edge computing leading investor demand.

Healthcare Facilities | Apr 13, 2023
Healthcare construction costs for 2023
Data from Gordian breaks down the average cost per square foot for a three-story hospital across 10 U.S. cities.

Higher Education | Apr 13, 2023
Higher education construction costs for 2023
Fresh data from Gordian breaks down the average cost per square foot for a two-story college classroom building across 10 U.S. cities.

Market Data | Apr 13, 2023
Construction input prices down year-over-year for first time since August 2020
Construction input prices increased 0.2% in March, according to an Associated Builders and Contractors analysis of U.S. Bureau of Labor Statistics Producer Price Index data released today. Nonresidential construction input prices rose 0.4% for the month.

Market Data | Apr 11, 2023
Construction crane count reaches all-time high in Q1 2023
Toronto, Seattle, Los Angeles, and Denver top the list of U.S/Canadian cities with the greatest number of fixed cranes on construction sites, according to Rider Levett Bucknall's RLB Crane Index for North America for Q1 2023.

Contractors | Apr 11, 2023
The average U.S. contractor has 8.7 months worth of construction work in the pipeline, as of March 2023
Associated Builders and Contractors reported that its Construction Backlog Indicator declined to 8.7 months in March, according to an ABC member survey conducted March 20 to April 3. The reading is 0.4 months higher than in March 2022.

Market Data | Apr 6, 2023
JLL’s 2023 Construction Outlook foresees growth tempered by cost increases
The easing of supply chain snags for some product categories, and the dispensing with global COVID measures, have returned the North American construction sector to a sense of normal. However, that return is proving to be complicated, with the construction industry remaining exceptionally busy at a time when labor and materials cost inflation continues to put pricing pressure on projects, leading to caution in anticipation of a possible downturn. That’s the prognosis of JLL’s just-released 2023 U.S. and Canada Construction Outlook.

Market Data | Apr 4, 2023
Nonresidential construction spending up 0.4% in February 2023
National nonresidential construction spending increased 0.4% in February, according to an Associated Builders and Contractors analysis of data published by the U.S. Census Bureau. On a seasonally adjusted annualized basis, nonresidential spending totaled $982.2 billion for the month, up 16.8% from the previous year.

Multifamily Housing | Mar 24, 2023
Average size of new apartments dropped sharply in 2022
The average size of new apartments in 2022 dropped sharply in 2022, as tracked by RentCafe. Across the U.S., the average new apartment size was 887 sf, down 30 sf from 2021, which was the largest year-over-year decrease.


